Crack Formation during Electrodeposition and Post-deposition Aging of Thin Film Coatings - 2nd Quarterly Report
Second Quarterly Report - AESF Research Project #R-118. This new NASF-AESF Foundation research project report covers the second quarter of project work (April-June 2016).
by
Prof. Stanko R. Brankovic*
University of Houston
Houston, Texas, USA
Editor’s Note: This NASF-AESF Foundation research project report covers the second quarter of project work (April-June 2016) on this new AESF Foundation Research project at the University of Houston. A printable PDF version is available by clicking HERE.
Personnel:
Stanko R. Brankovic, PI, Electrical and Computer Engineering and Chemical and Biomolecular Engineering, University of Houston,
Kamyar Ahmadi, PhD Student, Material Science Program, University of Houston,
Nikhil Chaudhuri, PhD Student, Material Science Program, University of Houston.
Objective:
The objective of this work is to study the fundamental and practical aspects of crack formation in electrodeposited thin films. The aim is to identify and quantify the key parameters of the electrodeposition process affecting the crack formation in thin films. This study should enable development of an effective strategy generally applicable in practice whenever an electrodeposition process for crack free films is demanded.
The activities performed in the second quarter were focused on initial studies of electrodeposition of chromium thin films of arbitrary thickness on polycrystalline copper substrates from Cr+3-containing electrolytes. The main focus of the experimental work was the EXDBA 1411 Bath with pH=5 (see http://short.pfonline.com/NASF16Nov2 for description).
Experimental approach
Current efficiency measurements
The initial work focused on accurate determination of the current efficiency for the EXDBA 1411 bath chemistry as a function of deposition current density at room temperature. The work performed involved deposition of chromium films with significant thickness (one hour deposition time), and precise measurements of the weight gain due to the formation of the chromium film. This mass was compared to the mass gain calculated from the deposition charge measurements during galvanostatic deposition. The ratio between the measured and calculated mass, assuming 100% current efficiency, is presented in the data in Fig. 1.
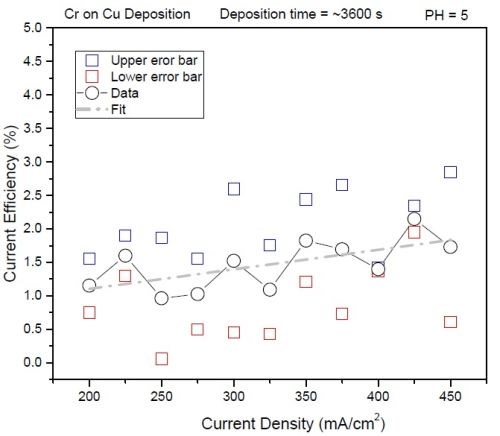
Figure 1 - The current efficiency of chromium deposition as a function of current density for the EXDBA 1411 bath, pH=5. The black circles are the average of three measurements; the blue and red dots represent the upper and lower error bar of the measurements. The gray dotted line is the linear fit of the data to emphasize the trend.
Each point in the data presented is an average of three measurements with an upper and lower error bar. The data indicate that the current efficiency has very low values, much lower than initially anticipated. Significant scattering of the data is also evident, and thus a vague linear trend identified by the fit can be taken with some caution. The efficiency increases with increasing current density although the values can be considered as scattered around 1%. For the point of further discussion, this will be taken as a good approximation, yet the true efficiency values will have to be determined from quartz microbalance measurements which are planned in the near future.
Interfacial pH calculations and threshold for Cr(OH)3 precipitation
For the purpose of this analysis, we considered that the main reactant during chromium deposition is, indeed, water. The reason for this is that the electrode rest potential during galvanostatic deposition in the range between 200‐450 mA/cm2, is significantly lower than the potential for water reduction (see http://short.pfonline.com/NASF16Nov2). Thus, the reaction:
2H2O + 2eˉ = 2OHˉ + H2↑ - Water reduction/ E= ‐1.125 V (pH<7, H+/Hˉ)
is dominant at the electrode solution interface due to the fact that the molarity of the solution in terms of water itself is 55M. This is much higher than that of the Cr+3 ion concentration, in our case ~0.5M, or H+ ions (10‐5M). Because of that, the water reduction reaction is the main source of OHˉ ions at the electrode interface. Because of that, the interfacial pH is a direct function of the magnitude of the deposition current and current efficiency. Assuming the linear concentration profile in the diffusion layer and the mass balance between generated OHˉ due to water reduction and the transport by diffusion to the bulk of the electrolyte, the interfacial concentration of OHˉ can be described by following relation:1
(1)
Here φ is the current efficiency (Fig. 1) while δdiff, DOH and KW stand for the diffusion layer thickness, diffusivity of OHˉ ions and ionic product of water, respectively. The concentration of OHˉ at the interface shows direct proportionality with the magnitude of the current density. Using the data in Table 1, we can now envision the values of the interfacial pH for EXDBA 1411 as a function of deposition current density, as in Fig. 2.
Table 1 - Tabular data for current efficiency.

The red line in Fig. 2 represents the threshold for Cr(OH)3 precipitation in terms of interfacial
OHˉ concentration defined as:
(2)
In our calculations, we assume that [Cr+3]i ≈ [Cr+3]∞ due to a very low current efficiency. As one can see, the threshold for chromium (III) hydroxide precipitation is greatly exceeded for the entire current range considered. This suggests that the hydroxide precipitation also represents a potential route of chromium deposition and O, H and H2O incorporation affecting the mechanical properties of the deposit, its fracture toughness, as well as grain boundary quality and lattice structure.
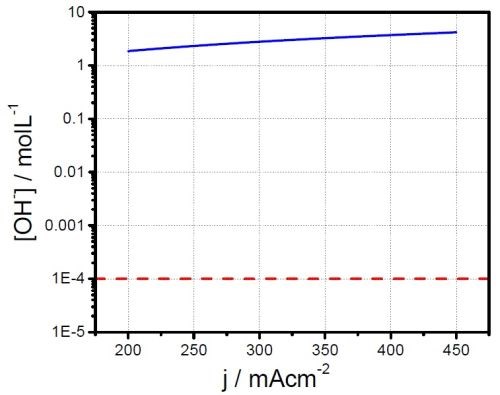
Figure 2 - Interfacial concertation of OHˉ ions as a function of the water reduction process. The red dotted line indicates the threshold of OHˉ concentration for Cr(OH)3 precipitation.
The in situ measurements of stress evolution in chromium films (EXDBA 1411 Bath with pH=5)
The set of more than 20 measurements have been performed evaluating in situ stress evolution in the chromium deposit as a function of current density. The typical thickness of chromium films exceeded 20 microns. The measurements shown here are the most representative runs exhibiting the typical trend we have observed, Figure 3(a-d). The experimental routine involved in situ monitoring of stress during the four-hour deposition of chromium films at different current densities, followed by a one-hour in situ monitoring of the stress evolution after the deposition was stopped.
In the last segment, the sample was not taken from the solution, so the post deposition stress evolution could be monitored with the sample still residing in solution at open circuit potential. This might be questionable due to the possibility of corrosion of the sample affecting the last part of the stress measurements. The same routine will be repeated in the future with the sample resting in air (Fig. 3). The representative data are organized in Fig. 3 as a, b, c and d segments in which the stress‐thickness and stress‐time evolution are shown for each current density accompanied by the optical images of the cantilevers and the surface of the chromium deposit acquired 3‐5 minutes after the experiment. The optical images serve to illustrate a lack of immediate crack appearance/detection for the cantilevers samples during and after the measurements which corroborates well with conclusions from the stress measurements.
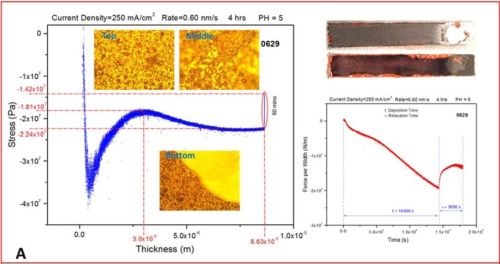
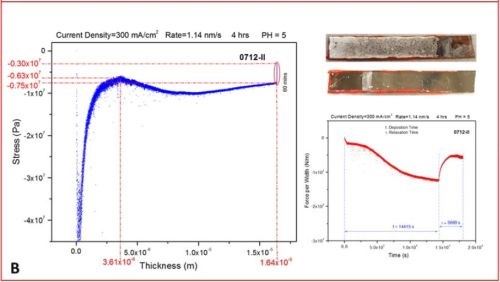
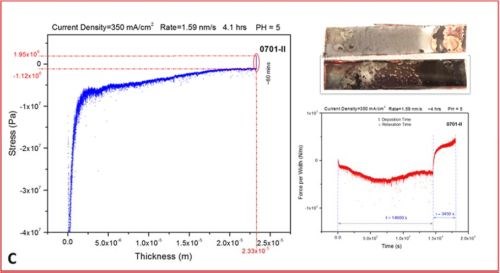
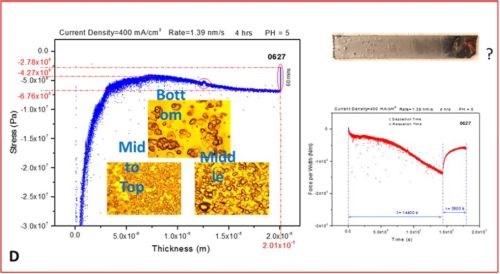
Figure 3 - The in situ stress measurements showing stress‐thickness, stress‐time evolution, optical images of the macroscopic cantilever samples and microscopic surface appearance. The deposition current used was (a) j =250 mA/cm2, (b) j =300 mA/cm2, (c) j =350 mA/cm2 and (d) j =400 mA/cm2.
Several fundamentally important observations are common for all our measurements:
- The value of the stress is negative though the entire range of thickness evolution for the chromium films regardless of the current density applied. This means that the crack propagation cannot occur under these conditions and indicates that for this bath and this temperature (room) it is unlikely that any cracking could occur during chromium deposition.
- The initial compressive stress related to nucleation of the chromium deposit (~‐50 to ‐70 MPa) gradually decreases (tensile relaxation) as the continuous film forms (~ 3 microns thickness), but it remains negative and after a thickness of 5 to 10 microns is exceeded, at which point it takes the steady state value of compressive stress until the very end of the deposition experiment. The value of the steady state compressive stress is a small function of deposition current density with no obvious trend observed, but commonly being in the range between ‐10 and ‐30 MPa. The negative sign of the stress the entire range of deposit growth indicates that the net balance between tensile stress generation due to grain boundary sliding and/or slip creep and compressive stress generation due to hydrogen incorporation and Cr‐hydride formation is overall in favor of Cr-hydride and hydrogen incorporation. This also indicates that the strength of grain boundaries is low due to preferential hydroxide precipitation at the grain boundaries as defect sites on the surface.
- In each measurement, after the growth of chromium films is stopped, a tensile relaxation of the stress occurs at open circuit potential. The magnitude of the tensile relaxation is function of applied current density and current efficiency (Fig. 4). The best insight in this process is observed following the stress‐time transients which are shown on the right side of each segment in Figure 3(a-d), red line. It is commonly observed that tensile relaxation enters steady state after approximately 30 minutes.
- In the present experimental circumstances, no discontinuous stress‐thickness behavior is observed, indicating no film cracking during deposition or during open circuit relaxation. In addition, the sign of stress being negative (compressive) indicates that no crack formation or support for crack propagation exists during the growth. Also, in the stress time relaxation process after the growth, no discontinuous stress‐time evolution is observed, indicating that open circuit relaxation does not occur after deposition (aging) crack formation or propagation. This is expected also from the overall sign of the stress, which is always negative even after one hour of tensile relaxation. These observations are reconfirmed via optical inspection of the samples after they are pulled from the solution, indicating no crack formation (Fig. 3).
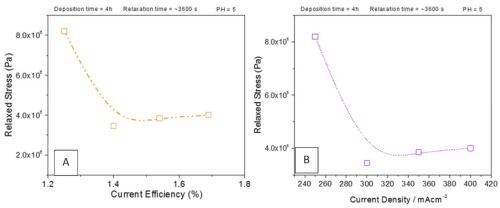
Figure 4 - Dependence of the magnitude of tensile relaxation of chromium films at open circuit as a function of (a) current efficiency and (b) current density. The data are extracted from Fig. 3, using indicated values (red color).
The data analysis also provides an insight into a dependence of the tensile relaxation at open circuit potential as a function of the deposition current density and deposition current efficiency (Fig. 4). From the presented data, it can be seen that tensile relaxation decreases with increasing current density and current efficiency. The trend is not a monotonic regression but rather a large decrease from 250 mA/cm2 to 300 mA/cm2 and then a constant trend. The same occurs when the current efficiency effect is analyzed. A large decrease in tensile relaxation is observed as the current efficiency increases from 1.3% to 1.4%, while a further increase in current efficiency has no effect on the magnitude of tensile relaxation.
The standard interpretation of the tensile relaxation in electrodeposited films during aging is a release of hydrogen that has been incorporated either as an interstitial solute in the metal matrix or as a hydride. Either option is possible when chromium is considered, and the width of the hydride region of stability is a function of temperature. At room temperature, and for the current densities used, one can anticipate formation of CrHx (0.5 < x < 1).2 Therefore, it is likely that the origin of the tensile relaxation observed in our case during open circuit corresponds to the breakup of Cr‐hydride and release of gaseous hydrogen. Considering that lower current densities show lower current efficiency, we anticipate that per chromium atom deposited, more Cr‐hydride is formed at 250 mA/cm2 deposition current than at higher values, and therefore, a decrease is expected. However, further increase in current efficiency and current density does not yield appreciable change in the magnitude of tensile relaxation. We conclude that this could be due to the limited amount of hydride accumulated, stable only within the surface layer, and thus not significantly dependent on the current density and/or current efficiency.
Impedance measurements
The in situ impedance measurements during chromium electrodeposition have yielded the same qualitative results as the stress measurements. Indeed, as expected due to a thickening of the chromium film, the charge transfer resistance during deposition steadily decreases asymptotically, approaching a steady state value. This pattern was repeated for all current densities investigated and no abrupt change in the charge resistance signal was observed. Thus, no crack formation was detected (data not shown). However, we have introduced a new sample design with the intent to measure the resistance of the chromium film during postdeposition aging at open circuit potential, OCP, (three hours), shown in Fig. 5(a). The resistance of the chromium films was determined using an AC signal at a 50 kHz frequency and an amplitude of 5 mV. Shown in Fig. 5(b-d), the results were quite interesting. The intent was to detect potential crack formation during sample relaxation at OCP with abrupt change in the resistance of the film. Interestingly, the data did not show an abrupt change of the thin film resistance, but rather a gradual one, which became constant in most of the samples after approximately 30 min to one hour.
The relative change of resistance was small, less than 2%. The largest increase in resistance of the chromium films was for samples deposited at the lowest current density. This correlates very well with the tensile stress relaxation data measured during the sample relaxation at OCP, comparing Fig. 4 vs. Fig. 6. One cautionary note is that the sample resistance might be affected by the corrosion process in formate solution. Therefore we do not hold strongly to the observed trend until we repeat the same measurement with samples aging in air. Yet, the agreement is very good with our tensile stress relaxation data, and therefore we can interpret it as follows.
The lower current density has a lower efficiency and therefore chromium films are deposited with more Cr‐hydride phase per chromium atom than samples deposited with higher current densities. As observed with the stress measurements, the breakup of the Cr‐hydride leads to tensile stress relaxation and also to the formation of point defects in the chromium films, or grain boundaries which serve as additional scattering points for electrons.
Therefore, liberated hydrogen during the aging process and Cr‐hydride decomposition are indirectly observed by a slight increase in resistance of the chromium films. More hydride in the chromium films means more defects created during aging process and therefore, more electron scattering. The same measurements will be repeated soon with samples aging in air.
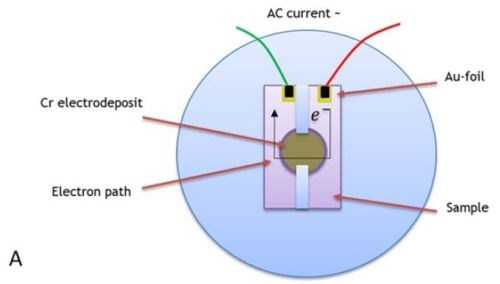
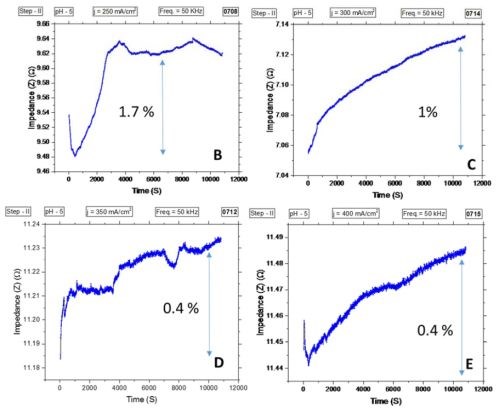
Figure 5 - (a) Sample geometry for AC resistance measurements of chromium films during relaxation at OCP in formate solution after deposition for 4 hr. Contacts for AC clips were made of gold foil to copper seed. The electron path is indicated, and sample copper seed is deposited on a silica substrate. Impedance measurements for samples deposited with (b) j = 250 mA/cm2, (c) j = 300 mA/cm2, (d) j = 350 mA/cm2 and (e) j = 400 mA/cm2.
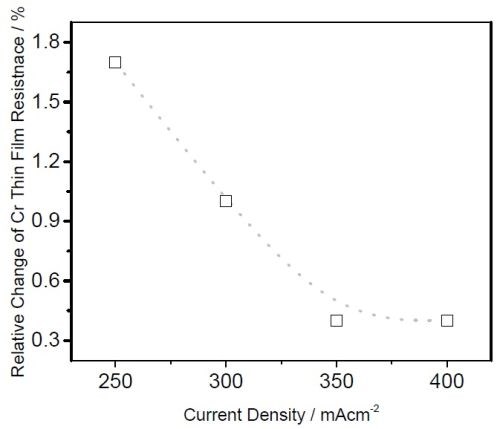
Figure 6 - Relative change of the chromium thin film impedance (resistance) as a function of the deposition current density during chromium film aging at OCP in formate solution. Data was extracted form Fig. 5 (b-d).
Summary
The activities in this period undoubtedly brought a wealth of new information about the electrodeposition process of chromium films in terms of their mechanical integrity, signs of stress and stress relaxation during aging. Although the most of the measurements do have a rather high level of complexity, we have achieved the routine in the sample preparation, experimental routine and data analysis that allows us to perform an abundant amount of work on a daily basis.
The stress measurements show that the sign of the stress in chromium films is negative, therefore suggesting no crack formation/propagation during the deposition stage. This is also reconfirmed with our impedance measurements, and our optical microscopy. Yet, it is possible that some level of cracking is present at the scale that is undetectable with the currently available methodology. It is also very important that we have reached quite a good level of qualitative and phenomenological understanding of the relation between deposition potential, interfacial pH, current efficiency and the observed sign of stress during deposition and during relaxation at OCP potential. The tensile stress relaxation during OCP is likely to be the result of Cr‐hydride decomposition and H2 release, which is detected also by the increasing resistance of the chromium films.
Both stress measurements and resistance measurements do correlate very well, therefore giving us a strong confidence to identify postdeposition aging of chromium films as the most important stage where the Cr‐film cracking can occur. In parallel with the experimental work, in our group, we continue to improve and sophisticate the measurement systems and sample preparation routine which improves our efficiency and capability to perform more experiments in shorter time. For the future, the plan is to repeat some of the stress relaxation measurements during chromium thin film aging in air, and to evaluate stress relaxation during annealing of chromium films at moderate temperatures. The writer gratefully acknowledges the donation of electrochemical equipment by Faraday Technology (Clayton, Ohio) which has been already put in good use.
References
1. S. Elhalawaty, et al., J. Electrochem. Soc., 158 (11) D641 (2011).
2. C.A. Snavely and D.A. Vaughan, JACS, 71 (1), 313–314 (1949); doi:10.1021/ja01169a085. ISSN 0002‐7863
About the author

Footnotes:
*Corresponding author:
Dr. Stanko R. Brankovic
Associate Professor
Department of Electrical & Computer Engineering
Department of Chemical & Biomolecular Engineering
Department of Chemistry
N 308 Engineering Building 1
Houston, Texas 77204-4005
Phone: (713) 743-4409
Fax: (713) 743-4444
E-mail: srbrankovic@uh.edu
Related Content
NASF/AESF Foundation Research Project #122: Electrochemical Approaches to Treatment of PFAS in Plating Wastewater - 12th Quarterly Report
This NASF-AESF Foundation research project report covers the 12th quarter of project work (October – December 2023) at the University of Georgia. In our previous report, we described our work on performance and effect of surface fluorinated Ti4O7 anodes on PFAS degradation in reactive electrochemical membrane (REM) mode. This quarter, our experiments involved utilizing porous Ti4O7 plates serving both as anodes and membranes. Tests compared pristine and F-18.6 Ti4O7 anodes at current densities of 10 mA/cm2 and 40 mA/cm2. This 12th quarterly report discusses the mechanisms of the effects on EO performance by anode surface fluorination.
Read MoreDevelopment of a Novel Hexavalent-Chromium-Free Aluminum Sacrificial Paint
Hexavalent chromium is a known carcinogen, repro-toxin, and mutagen. Its elimination is of high importance to the aerospace industry, which has struggled to find high performing alternatives. Legacy aluminum sacrificial paints have traditionally utilized hexavalent chromium to prevent corrosion and coatings which are equal to or better than have been difficult. This first paper discusses the novel process from the supplier point-of-view.
Read MoreNASF/AESF Foundation Research Project #123: Electrochemical Manufacturing for Energy Applications – 4th and 5th Quarter Report
The NASF-AESF Foundation Research Board selected a project on electrodeposition toward developing low-cost and scalable manufacturing processes for hydrogen fuel cells and electrolysis cells for clean transportation and distributed power applications. During the reporting period, efforts were focused on planning the overall project work, with the eventual goal of manufacturing an improved design for a Solid oxide fuel cell anode supported flat tube (SOFC).
Read MoreLooking Back: The Columnists
Many industrial/technical journals consist of a well-rounded mixture of technical papers, practical articles about technology and how-to-do-it features, including this one, Products Finishing. In its decades of publication, the AESF/NASF journal, Plating & Surface Finishing also endeavored to meet this need. Among the many features were those of the columnists, recognized experts who had expertise in certain segments of the surface finishing industry. This article contains a sampling of columns published in P&SF over the years, which still retain information of importance even today.
Read MoreRead Next
Episode 45: An Interview with Chandler Mancuso, MacDermid Envio Solutions
Chandler Mancuso, technical director with MacDermid Envio discusses updating your wastewater treatment system and implementing materials recycling solutions to increase efficiencies, control costs and reduce environmental impact.
Read MoreEducation Bringing Cleaning to Machining
Debuting new speakers and cleaning technology content during this half-day workshop co-located with IMTS 2024.
Read MoreA ‘Clean’ Agenda Offers Unique Presentations in Chicago
The 2024 Parts Cleaning Conference, co-located with the International Manufacturing Technology Show, includes presentations by several speakers who are new to the conference and topics that have not been covered in past editions of this event.
Read More




.jpg;maxWidth=300;quality=90)


