Chemically Accelerated Vibratory Surface Finishing (CAVSF) with Oxalic Acid-Based Solutions
It has been shown that the inexpensive chemically accelerated vibratory surface finishing (CAVSF) process can reduce the average surface roughness.
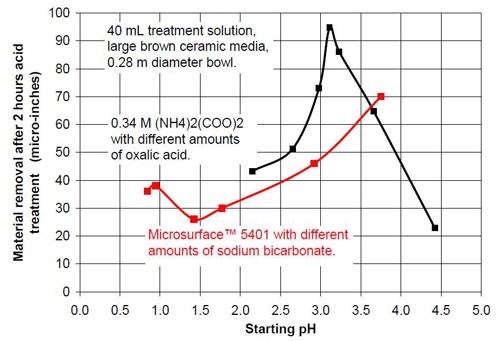
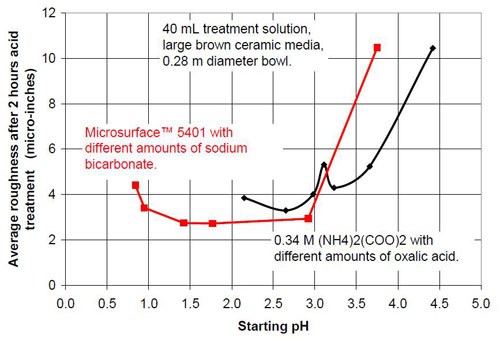
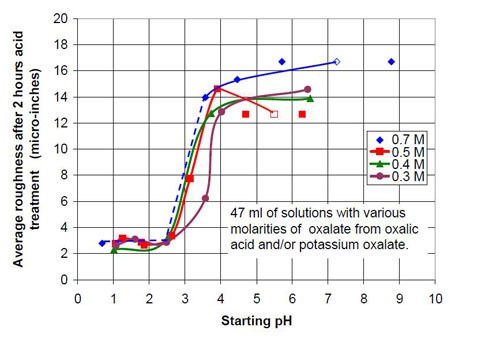
It has been shown that the inexpensive chemically accelerated vibratory surface finishing (CAVSF) process can reduce the average surface roughness of helicopter gear teeth from the conventional 16 μ-in. (0.39 μm) down to approximately 2 μ-in. (0.05 μm). Consequently the friction and the surface stress at the mating surfaces are substantially decreased, which results in a 300 to 400% increased fatigue lifetime, reduced downtime, less noise, higher energy efficiency, lower overall costs and reduced component weight if newly designed. The CAVSF process with different oxalic acid based solutions was studied using strip steel samples AISI 1018 in a 0.28 m diameter vibratory bowl. The effects of the chemical composition and concentration on the process were examined. The average end roughness and the material removal reached with the process were charted versus the pH of the different mixtures. The best results concerning average end roughness gave oxalic acid solutions with a pH around 1. At pH values higher than 3.0, the average end roughness starts increasing rapidly with pH. At a pH around 2.0, the material removal versus pH curve reaches a minimum and at a pH around 3.8, a maximum.
Introduction
Machining grind lines are a problem in critical working surfaces on gears, splines, journals, crankshafts, bearings, camshafts and couplings. These grind lines can have an average roughness of around 12 μ-in. (0.30 μm) and will impair lubricity. They cause vibration, friction, torque, higher operation temperature and noise. This leads to metal debris, plastic deformation, scuffing, wear and several forms of fatigue, which limit the useful life of equipment.
Throughout the world, the word superfinishing is often used for vibratory finishing, superhoning, stone finishing, tape finishing and microfinishing. Chemically accelerated vibratory surface finishing (CAVSF) is an isotropic surface finishing (ISF) process, which uses chemicals from a treatment solution to attack the surface and build a conversion layer. Ceramic or plastic media rubs off the conversion layer in a vibratory bowl. The CAVSF process is an environmentally friendly, inexpensive process to remove the machine grind lines, damaged material and asperities from the metal surface.1,2,3 It also reduces the stress risers.
The average surface roughness of case hardened steel surfaces on gear teeth decreases from around 12 μ-in. (0.30 μm) to around 2 μ-in. (0.05 μm) by using CAVSF. During the process, generally less than 200 μ-in. (5 μm) of material is removed. The geometry of the part is not impaired.
In this paper, the “removed material” is measured in μ-in (39.4 μ-in. = 1 μm). The removed material represents the average thickness of solid removed material across the whole geometrical surface area of the part. It is obvious, then, that the local removed material is higher on corners and edges and lower in cavities and recesses than this average. The weight loss and the specific density of the part are used for the calculation.
The average roughness Ra is measured with a profilometer that has a stylus with a 45° diamond cone. The tip of the cone has a radius of 1 μm or approximately 40 μ-in. The measured values for the average roughness are mostly between 0.5 and 30 μ-in. The diamond tip cannot measure the real average roughness which is about four times higher than the measured average roughness.4 The measured maximum roughness is about ten times higher than the measured average roughness.
It was found that the measured life improvement for superfinished gears was a factor of approximately five compared with conventional gears (average roughness: up to 16 μ-in. (0.41 μm) on the pitch line).5 A run-in time for superfinished surfaces is not required. Other benefits connected with the CAVSF process are reduced downtime, reduced component weight in new designs, less noise, less vibration, higher energy efficiency and lower overall costs.
This publication is part of the combined efforts of the Engineered Surfaces Center, which is part of the School of Engineering and Mines at the University of North Dakota, and Alion Science and Technology to validate, investigate, optimize and possibly improve the existing CAVSF process for critical surfaces. The report shows the results from the Engineered Surfaces Center concerning the investigation of the CAVSF process. Material removal and roughness changes during the process on different surfaces were measured, and process parameters were varied.
Test equipment and process steps
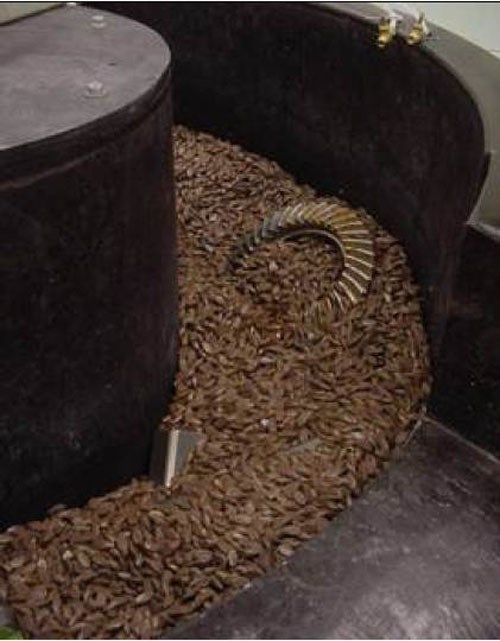
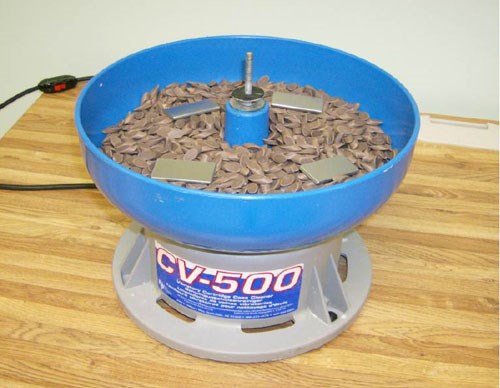
Two different vibratory bowls (Figs. 1 to 3) were available for testing the CAVSF process. The first has an inner diameter of 1.16 m, and the second has an inner diameter of 0.28 m.
During the process, a continuous flow of chemical solutions runs through the large vibratory bowl, which is filled with ceramic media, test pieces and additional steel parts. The vibratory motors run at 1800 rpm. The media and the test parts move in a toroidal helix around the bowl. Acid treatment solution is then sprayed into the bowl with a flow rate of 1.5 gal/hr (5.7 L/hr) for the first two hours, followed by a 15-minute water rinse cycle of 15 gal/hr (56.8 L/hr). Finally, 10 gal/hr (37.8 L/hr) burnishing solution runs through the vibratory bowl. The parts are taken out after approximately one hour of burnishing, rinsed in tap water and then in demineralized water, and dried with paper towels.
The small bowl (Fig. 3) runs without the continuous flow of chemicals and is filled with 2.2 L of ceramic media, four test pieces and a defined amount of treatment solution (hold-up). The acid treatment time is usually two hours as in the large bowl. It was found useful to run these quick tests with small amounts of different treatment solutions in the small bowl because fewer chemicals were wasted and cleaning and drying of the bowl and the media was easy. The roughness results were comparable but the material removal rate was only half. If needed the testing of the solution was repeated in the large vibratory bowl.
The influence of the pH in the chemically accelerated vibratory surface finishing (CAVSF) process with oxalic acid-based solutions
This paper will focus on the influence that the acidity, measured as pH, of some oxalic acid-based treatment solutions has on the material removal and the end roughness of the CAVSF process. It is the continuation of work published previously.6-9
Phase I: Proprietary and ammonium oxalate systems
In the first part of this work, two different acid treatment solutions were tested:
- 20 mL proprietary oxalic acid-based acid treatment solution** with 20 mL of proprietary solution or 20 mL water or 20 mL of sodium bicarbonate solution of various concentrations (Table 1)
- 0.34M ammonium oxalate solution with various concentrations of oxalic acid (Table 2).
Phase II: Oxalic acid / sodium oxalate systems
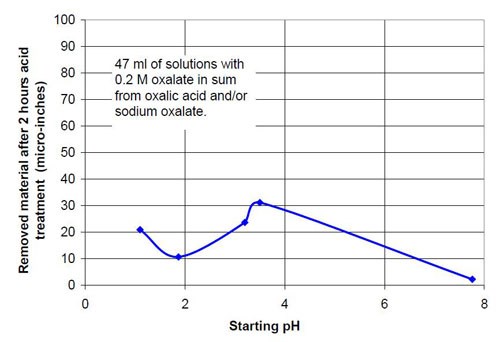
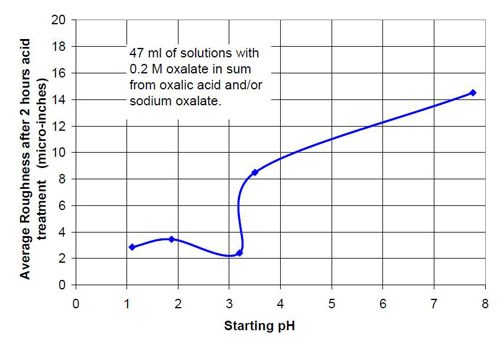
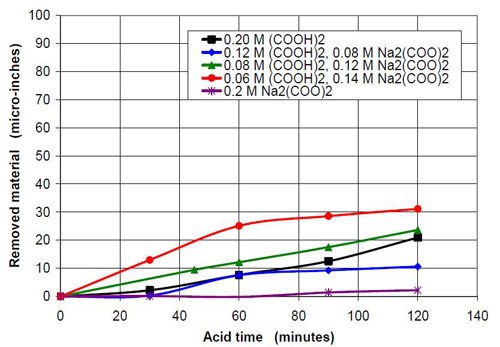
In the second part of this test series, different acid treatment solutions based on oxalic acid and sodium oxalate were tested (Table 3). Forty-seven milliliters of acid treatment solution made from various amounts of 0.2M oxalic acid and 0.2M sodium oxalate solution were added to 3745 g of white lens-shaped ceramic media and four AISI 1018 strip steel samples. Solutions consisting of large amounts of oxalic acid and small amounts of sodium oxalate were not soluble, therefore often not used for testing. Precipitation of oxalic acid monohydrate occurred.
The average roughness of these samples was between 15 and 20 μ-in. at the beginning of the test. Every half hour, a strip steel sample was taken out, rinsed with demineralized water and dried with a paper towel. The roughness was measured and the weight loss determined to calculate the material removed in μ-in. After two hours of acid treatment time, the test was terminated.
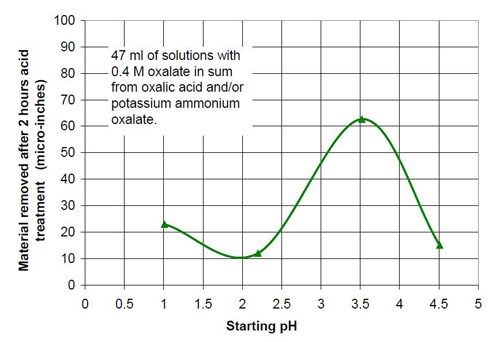
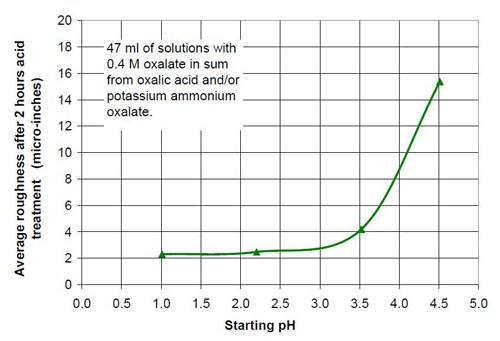
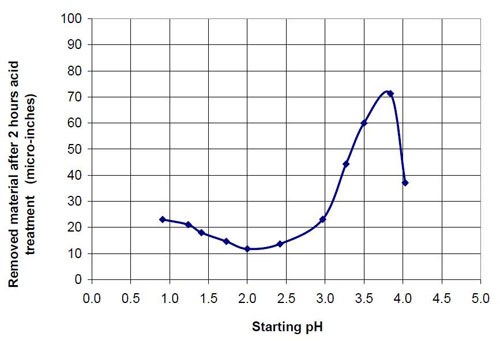
Figures 6 and 7 show the material removal and the average roughness after two hours of acid treatment versus the pH of these acid treatment solutions. The material removed after two hours of acid treatment goes through a minimum at approximately pH 1.9 (Fig. 6). It is assumed that the material removal decreases with increasing pH after reaching a maximum at approximately pH 3.5. The average roughness after two hours of acid treatment (Fig. 7) is around 3 μ-in. in the pH range of 1.1 to 3.2. At a higher pH, the roughness does not decrease as much as at the lower pH ranges.
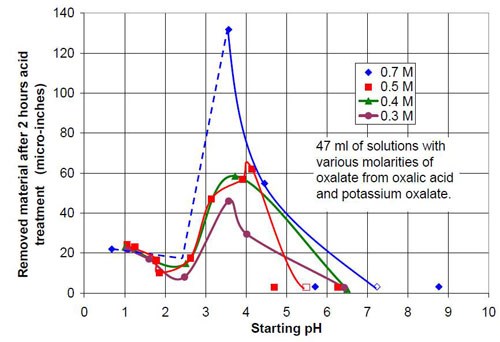
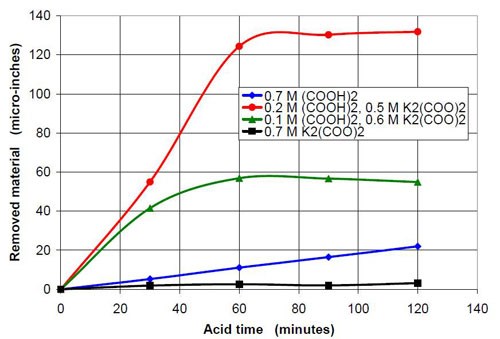
For the third part of this test series, different acid treatment solutions, mostly based on oxalic acid and potassium oxalate were tested. It is known that in general potassium salts have an even higher solubility in water than sodium salts. The objective was to see what would happen if the concentration of oxalate and the pH were increased. Potassium oxalate solutions were produced by adding potassium bicarbonate to an equivalent amount of oxalic acid. Unfortunately the carbon dioxide produced was hard to remove by cooking the solution because the expected pH was above 7. This resulted in potassium oxalate solutions with more or less dissolved carbon dioxide and a higher or lower solution pH. This is reason why the 0.5 and 0.7M potassium oxalate solutions have a pH span in Tables 4 and 5 and in Figs. 8 and 9.
Forty-seven milliliters of acid treatment solution made from various amounts of 0.7M oxalic acid and 0.7M sodium oxalate solution were added to 3745 g of white lens-shaped ceramic media and four AISI 1018 strip steel samples. Solutions consisting of large amounts of oxalic acid and small amounts of potassium oxalate were not stable, and precipitation occurred. Therefore these solutions were not used for testing. More information about the 0.7M solutions used is given in Table 4.
Phase IV: Oxalic acid / potassium ammonium oxalate systems
For the fourth part of this test series, different acid treatment solutions based on oxalic acid and potassium ammonium oxalate (Table 8) were tested. The reason for this test series was to determine if by adding ammonium oxalate, the solubility and concentration of oxalate anion coming from oxalic acid and oxalate salt, could be increased. Ultimately this did not happen, but the results were worth the effort. Forty-seven milliliters of acid treatment solution made from various amounts of 0.4M oxalic acid and 0.4M potassium ammonium oxalate solution were added to 3745 g of white lens-shaped ceramic media and four AISI 1018 strip steel samples. Solutions consisting of large amounts of 0.4M oxalic acid and small amounts of 0.4M potassium ammonium oxalate were not stable, therefore not used for testing. Precipitation of oxalic acid monohydrate occurred.
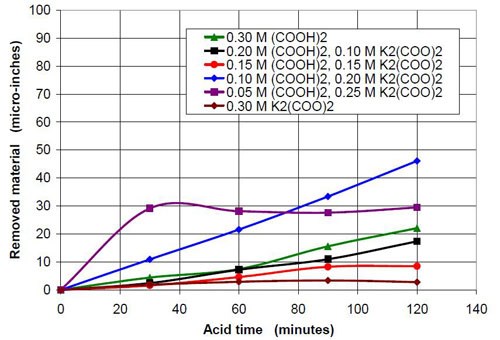
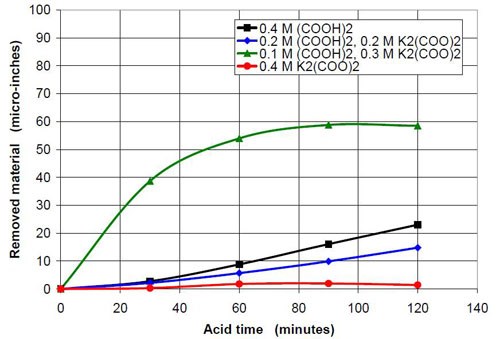
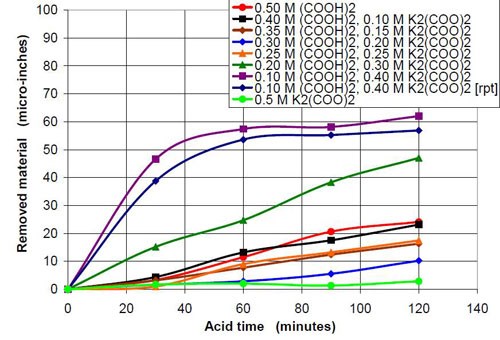
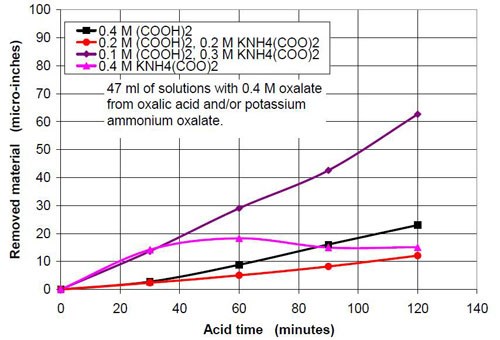
The material removal rates for all solutions with sodium or potassium oxalate and a relatively small amount of oxalic acid are extremely high when compared to the other values in the test series. The maximum material removal rate of a test series at the beginning of the process increases with the oxalate concentration (the sum of the oxalic acid and oxalate salt concentration). It is 25 μ-in./hr for the 0.2M oxalate concentration (Fig. 12) and 125 μ-in./hr for 0.7M oxalate solutions (Fig. 16).
Another observation can be made if Figs. 14 and 17 are compared. Both graphs show a plot for 0.4M oxalate. Figure 14 shows the mixtures of oxalic acid and potassium oxalate and Figure 17 the mixture of oxalic acid and potassium ammonium oxalate. Obviously the ammonium cation increases the removal rate at the beginning of the process with 0.4M salt solution (no acid). With some acid in the solution at 0.1M (COOH)2 and 0.3M KNH4(COO)2, the removed material increased linearly with time for two hours instead of leveling out as observed with 0.1M (COOH)2 and 0.3M K2(COO)2.
Phase V: Oxalic acid / ammonium oxalate systems
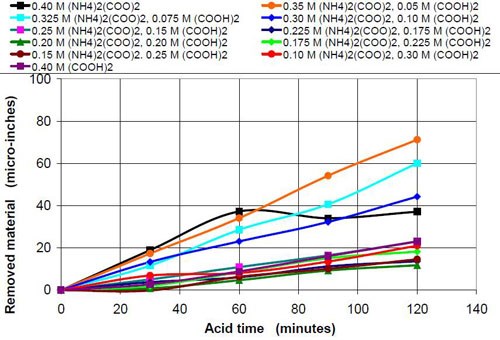
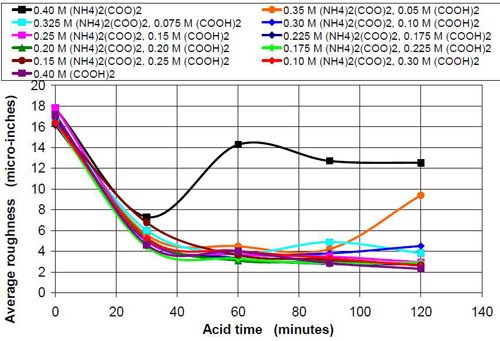
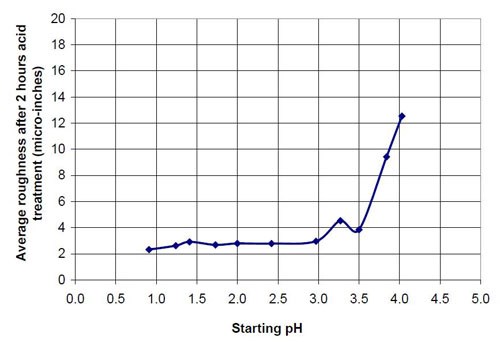
The influence that solution acidity has on material removal and end roughness of the CAVSF process was investigated with 0.4M oxalate solutions consisting of various amounts of 0.4M oxalic acid and 0.4M ammonium oxalate solution. Each mixture of these solutions was completely soluble and did not form precipitates at room temperature. Ammonium oxalate was chosen because of the high solubility in water the low pH of the salt solution and the ability of the ammonium molecule to build week complexes with the iron ions, which could have a visible effect on the process. No other investigated 0.4M oxalate solution showed this high solubility, not sodium, not potassium and not potassium ammonium oxalate.
Table 9 describes the composition and the pH of the solutions at the beginning of the test and also the end results, i.e., the material removed and the average roughness at the end of the two-hour acid treatment.
The chemically accelerated vibratory surface finishing (CAVSF) process with different oxalic acid-based solutions was studied using strip steel samples AISI 1018 in a 0.28 m diameter vibratory bowl. The effects of chemical composition and concentration on the process were examined. The average end roughness and the material removal reached with the process were charted versus the pH of the different mixtures. The best results concerning average end roughness gave oxalic acid solutions with a pH around 1. At pH values higher than 3, the average end roughness first increased rapidly with pH. At a pH around 2, the material removal versus pH curve reached a minimum and at a pH around 3.8 a maximum.
Acknowledgements
Thanks go to our former director Bryce Mitton, my colleagues and partner engineers Douglas Larson, Matthew Cavalli, Samar Kalita, Marcellin Zahui (Engineered Surfaces Center, University of North Dakota, Grand Forks, ND), our program manager and Benjamin Hoiland and partner engineers Ranko Todorovic, Damian Wilmot and Jarrod Schell, (Alion Science and Technology, Grand Forks, ND) for their input and help in completing the project. I am also thankful to my students, who did a great job running and evaluating most of the tests: Tyrone Garro, Dustin Umland, Brian Trenbeath, Jennifer Vein, Jennie Jorgenson, Jessica Messer, Allison Vosgerau, Eric Lentz, Eric Zimny, Shannon Hewson, Paul Nordvik, Matthew Gerszewski and Thomas James (University of North Dakota)
This project was sponsored by the Defense Technical Information Center. The work was made possible by the contractual relationship between AMMTIAC and DoD to research and analysis of advanced materials. This includes US Army Benét Laboratories with US Army ARDEC (Armament Research, Development and Engineering Center).
- M. Michaud, et al., U.S. Patent 4,491,500 (1985).
- M. Michaud, U.S. Patent 4,818,333 (1989).
- F. Hashimoto, U.S. Patent 5,873,770 (1999).
- K.G. Budinski & M.K. Budinksi, Engineering Materials: Properties and Selection, Pearson Education, Upper Saddle River, NJ, 2002 (9th Ed., Prentice-Hall, Upper Saddle River, NJ, 2009).
- T. Krantz, The Influence of Roughness on Gear Surface Fatigue - NASA/TM Report 2005-213958, NASA-Glenn Research Center, Cleveland, OH, 2005; http://gltrs.grc.nasa.gov/reports/2005/TM-2005-213958.pdf (last accessed 01/31/11).
- J. Fischer, B. Mitton & J. Rindt, “Studies concerning Chemically Accelerated Vibratory Surface Finishing,” Proc. DoD Corrosion Conference, Gaylord National, DC, 2009.
- J. Fischer, et al., “An Overview of the Engineered Surfaces for Weapons Systems Life Extension Program,” The AMMTIAC Quarterly, 3 (2), 3 (2008); http://ammtiac.alionscience.com/pdf/AQV3N2.pdf (last accessed 01/31/11).
- J. Fischer, et al., “Advances in Chemically Accelerated Vibratory Surface Finishing (CAVSF),” Proc. NASF SUR/FIN 2008, NASF, Washington, DC, 2008; p. 65.
- J. Fischer, et al., “Basic Studies Concerning Chemically Accelerated Vibratory Surface Finishing (CAVSF),” Proc. TriService Corrosion Conference, Denver, CO, NACE International, Houston, TX, 2007.
Proprietary oxalic acid-based solution | |||
Starting pH of the acid | Material removal after 2 hr acid treatment, μ-in. | Average roughness after 2 hr acid treatment, μ-in. | Composition of the 40 mL treatment solution (3975 g large brown media, 0.28 m diameter vibratory bowl) |
0.84 | 36 | 4.4 | 40 mL Proprietary solution |
0.95 | 38 | 3.41 | 20 mL Proprietary solution, 20 mL water |
1.42 | 26 | 2.74 | 20 mL Proprietary solution, 20 mL 0.35M NaHCO3 solution |
1.77 | 30 | 2.72 | 20 mL Proprietary solution, 20 mL 0.525M NaHCO3 solution |
2.92 | 46 | 2.93 | 20 mL Proprietary solution, 20 mL 0.70M NaHCO3 solution |
3.75 | 70 | 10.48 | 20 mL Proprietary solution, 20 mL 1.05M NaHCO3 solution |
**Microsurface 5401™, Houghton International, Valley Forge, Pennsylvania.
Table 2 - Information about the ammonium oxalate solutions used for the tests.
0.34M ammonium oxalate and various amounts of oxalic acid | |||
Starting pH of the acid | Material removal after 2 hr acid treatment, μ-in. | Average roughness after 2 hr acid treatment, μ-in. | Composition of the 40 mL treatment solution (3975 g large brown media, 0.28 m diameter vibratory bowl) |
2.15 | 43 | 3.85 | < 0.34M (COOH)2; 0.34M (NH4)2(COO)2 |
2.65 | 51 | 3.30 | 0.27M (COOH)2; 0.34M (NH4)2(COO)2 |
2.98 | 73 | 4.01 | 0.20M (COOH)2; 0.34M (NH4)2(COO)2 |
3.11 | 95 | 5.32 | 0.17M (COOH)2; 0.34M (NH4)2(COO)2 |
3.23 | 86 | 4.29 | 0.14M (COOH)2; 0.34M (NH4)2(COO)2 |
3.66 | 65 | 5.24 | 0.10M (COOH)2; 0.34M (NH4)2(COO)2 |
4.42 | 23 | 10.45 | 0.30M (NH4)2(COO)2 |
0.2M oxalate in sum from oxalic acid and sodium oxalate | |||
Starting pH of the acid | Material removal after 2 hr acid treatment, μ-in. | Average roughness after 2 hr acid treatment, μ-in. | Composition of the 47 mL treatment solution (0.2M oxalate treatment solution in sum from sodium oxalate and oxalic acid, 3745 g white lens shaped media, 0.28 m diameter vibratory bowl). |
1.10 | 21 | 2.86 | 0.20M (COOH)2 |
1.87 | 11 | 3.45 | 0.12M (COOH)2, 0.08M Na2(COO)2 |
3.20 | 24 | 2.42 | 0.08M (COOH)2, 0.12M Na2(COO)2 |
3.50 | 31 | 8.49 | 0.06M (COOH)2, 0.14M Na2(COO)2 |
7.76 | 2 | 14.51 | 0.20M Na2(COO)2 |
0.7M oxalate from oxalic acid and potassium oxalate | |||
Starting pH of the acid | Material removal after 2 hr acid treatment, μ-in. | Average roughness after 2 hr acid treatment, μ-in. | Composition of the 47 mL treatment solution (0.7M oxalate treatment solution in sum from potassium oxalate and oxalic acid, 3745 g white lens shaped media, 0.28 m diameter vibratory bowl) |
0.68 | 22 | 2.79 | 0.7M (COOH)2 |
3.57 | 132 | 13.96 | 0.2M (COOH)2, 0.5M K2(COO)2 |
4.46 | 55 | 15.33 | 0.1M (COOH)2, 0.6M K2(COO)2 |
5.71 - 8.77 | 3 | 16.70 | 0.7M K2(COO)2 |
0.5M oxalate from oxalic acid and potassium oxalate | |||
Starting pH of the acid | Material removal after 2 hr acid treatment, μ-in. | Average roughness after 2 hr acid treatment, μ-in. | Composition of the 47 mL treatment solution (0.5M oxalate treatment solution in sum from potassium oxalate and oxalic acid, 3745 g white lens shaped media, 0.28 m diameter vibratory bowl) |
1.06 | 24 | 2.76 | 0.50M (COOH)2 |
1.25 | 23 | 3.20 | 0.40M (COOH)2, 0.10M K2(COO)2 |
1.78 | 16 | 2.88 | 0.35M (COOH)2, 0.15M K2(COO)2 |
1.86 | 10 | 2.66 | 0.30M (COOH)2, 0.20M K2(COO)2 |
2.63 | 17 | 3.39 | 0.25M (COOH)2, 0.25M K2(COO)2 |
3.14 | 47 | 7.76 | 0.20M (COOH)2, 0.30M K2(COO)2 |
4.15 | 62 | 28.45 | 0.10M (COOH)2, 0.40M K2(COO)2 |
4.7 - 6.28 | 3 | 12.69 | 0.50M K2(COO)2 |
0.4M oxalate from oxalic acid and potassium oxalate | |||
Starting pH of the acid | Material removal after 2 hr acid treatment, μ-in. | Average roughness after 2 hr acid treatment, μ-in. | Composition of the 47 mL treatment solution (0.4M oxalate treatment solution in sum from potassium oxalate and oxalic acid, 3745 g white lens shaped media, 0.28 m diameter vibratory bowl) |
1.01 | 23 | 2.31 | 0.4M (COOH)2 |
2.51 | 15 | 3.23 | 0.2M (COOH)2, 0.2M K2(COO)2 |
3.73 | 59 | 12.74 | 0.1M (COOH)2, 0.3M K2(COO)2 |
6.50 | 2 | 13.89 | 0.40M K2(COO)2 |
0.3M oxalate from oxalic acid and potassium oxalate | |||
Starting pH of the acid | Material removal after 2 hr acid treatment, μ-in. | Average roughness after 2 hr acid treatment, μ-in. | Composition of the 47 mL treatment solution (0.3M oxalate treatment solution in sum from potassium oxalate and oxalic acid, 3745 g white lens shaped media, 0.28 m diameter vibratory bowl) |
1.07 | 22 | 2.65 | 0.30M (COOH)2 |
1.60 | 17 | 3.11 | 0.20M (COOH)2, 0.10M K2(COO)2 |
2.48 | 8 | 2.87 | 0.15M (COOH)2, 0.15M K2(COO)2 |
3.57 | 46 | 6.23 | 0.10M (COOH)2, 0.20M K2(COO)2 |
4.02 | 29 | 12.87 | 0.05M (COOH)2, 0.25M K2(COO)2 |
6.43 | 3 | 14.58 | 0.30M K2(COO)2 |
0.4M oxalate from oxalic acid and potassium ammonium oxalate | |||
Starting pH of the acid | Material removal after 2 hr acid treatment, μ-in. | Average roughness after 2 hr acid treatment, μ-in. | Composition of the 47 mL treatment solution (0.4M oxalate treatment solution in sum from potassium ammonium oxalate and oxalic acid, 3745 g white lens shaped media, 0.28 m diameter vibratory bowl) |
1.01 | 23 | 2.31 | 0.4M (COOH)2 |
2.20 | 12 | 2.49 | 0.2M (COOH)2, 0.2M KNH4(COO)2 |
3.52 | 63 | 4.20 | 0.1M (COOH)2, 0.3M KNH4(COO)2 |
4.51 | 15 | 15.37 | 0.4M KNH4(COO)2 |
0.4 M oxalate in sum from oxalic acid and ammonium oxalate | |||
Starting pH of the acid | Material removal after 2 hr acid treatment, μ-in. | Average roughness after 2 hr acid treatment, μ-in. | Composition of the 47 mL treatment solution (3975 g large brown media, 0.28 m diameter vibratory bowl) |
0.91 | 23 | 2.31 | 0.4M (COOH)2, 0M (NH4)2(COO)2 |
1.24 | 21 | 2.62 | 0.3M (COOH)2, 0.1M (NH4)2(COO)2 |
1.41 | 18 | 2.91 | 0.225M (COOH)2, 0.175M (NH4)2(COO)2 |
1.73 | 15 | 2.68 | 0.25M (COOH)2, 0.15M (NH4)2(COO)2 |
2.00 | 12 | 2.78 | 0.2M (COOH)2, 0.2M (NH4)2(COO)2 |
2.42 | 14 | 2.78 | 0.175M (COOH)2, 0.225M (NH4)2(COO)2 |
2.97 | 23 | 2.96 | 0.15M (COOH)2, 0.25M (NH4)2(COO)2 |
3.27 | 44 | 4.53 | 0.1M (COOH)2, 0.3M (NH4)2(COO)2 |
3.5 | 60 | 3.84 | 0.075M (COOH)2, 0.325M (NH4)2(COO)2 |
3.84 | 71 | 9.41 | 0.05M (COOH)2, 0.35M (NH4)2(COO)2 |
4.03 | 37 | 12.53 | 0M (COOH)2, 0.4M (NH4)2(COO)2 |
_______________________
* Corresponding author:
E-mail: JuergenFischer@mail.und.nodak.edu
Related Content
Electroplating in the Context of Worldwide Nanotechnology Initiatives: A Heritage Paper
In the first part, a summary is presented on recently established nanotechnology initiatives in various countries around the world. Program funding levels and core activities will be compared to provide a basis for assessing business opportunities for various industries. The second part of the paper looks at specific examples of nanostructures made by electrochemical methods currently at various stages in their development, or already in use.
Read MoreHighlights from SUR/FIN 2023
Products Finishing offers a recap of some of the topics that were top of mind at the SUR/FIN 2023 finishing industry trade show.
Read MoreNASF/AESF Foundation Research Project #121: Development of a Sustainability Metrics System and a Technical Solution Method for Sustainable Metal Finishing - 15th Quarterly Report
This NASF-AESF Foundation research project report covers the twelfth quarter of project work (October-December 2023) at Wayne State University in Detroit. In this period, our main effort focused on the development of a set of Digital Twins (DTs) using the Physics-Informed Neural Network (PINN) technology with application on parts rinsing simulation.
Read MoreHexavalent-Chromium-Free Aluminum Sacrificial Paint Validation
Hexavalent chromium is a known carcinogen, repro-toxin and mutagen. Its elimination is of high importance to the aerospace industry, which has struggled to find high performing alternatives. Legacy aluminum sacrificial paints have traditionally utilized hexavalent chromium to prevent corrosion and coatings which are equal to or better than have been difficult. This second of two papers discusses the hexavalent-chromium-free process from the user point-of-view in terms of the process validation work by Rolls Royce Corporation.
Read MoreRead Next
Delivering Increased Benefits to Greenhouse Films
Baystar's Borstar technology is helping customers deliver better, more reliable production methods to greenhouse agriculture.
Read MoreEpisode 45: An Interview with Chandler Mancuso, MacDermid Envio Solutions
Chandler Mancuso, technical director with MacDermid Envio discusses updating your wastewater treatment system and implementing materials recycling solutions to increase efficiencies, control costs and reduce environmental impact.
Read MoreEducation Bringing Cleaning to Machining
Debuting new speakers and cleaning technology content during this half-day workshop co-located with IMTS 2024.
Read More



.jpg;maxWidth=600)
.jpg;maxWidth=600)






.jpg;maxWidth=300;quality=90)


