Corrosion Resistance of High-Phosphorus Electroless Nickel with a Lower Coefficient of Friction, Nanoparticle Codeposition Electroless Nickel Layer
This paper is a peer-reviewed and edited version of a presentation delivered at NASF SUR/FIN 2013 in Rosemont, Ill., on June 11, 2013.
by Nicole Micyus, MacDermid Inc.
Editor's Note: This paper is a peer-reviewed and edited version of a presentation delivered at NASF SUR/FIN 2013 in Rosemont, Ill., on June 11, 2013. A printable PDF version is available by clicking HERE.
Abstract
The corrosion resistance of high phosphorus electroless nickel (EN) is well-known. But how is the corrosion resistance affected by an overlayer of a lower coefficient of friction electroless nickel? The two codeposited nanoparticles under study in the upper layer are polytetrafluoroethylene (PTFE) and boron nitride (BN), separately. EN/PTFE and EN/BN deposits of various wt% concentrations are plated over high phosphorus electroless nickel and the neutral salt spray (NSS) results are compared to those for a single layer of high phosphorus EN.
Keywords: Electroless nickel, high phosphorus electroless nickel, nanoparticle codeposition, PTFE, boron nitride, corrosion resistance, nanocomposite overlayers
Introduction
The corrosion resistance of high phosphorus electroless nickel (EN) is well-known. Typically, high phosphorus deposits of 1 mil (25 µm) thickness or more can pass 1,000 hrs in neutral salt spray (NSS) testing. It has been shown that duplex EN coatings using high phosphorus as a base deposit can yield neutral salt spray (NSS) results well above 1,000 hrs with low/mid- and mid-phosphorus EN deposits.1 A high-phosphorus electroless nickel is the lower layer, which provides corrosion resistance, while the upper layer endows a particular property needed for a specific application. In this paper, the upper layer consists of a codeposition EN deposit with particles such as polytetrafluoroethylene (PTFE) and boron nitride (BN).
Both EN/PTFE and EN/BN deposits provide a lower coefficient of friction than that of high-phosphorus EN. They are utilized primarily in the automotive, machinery, engineering, and mold and die industries. The lower coefficient of friction deposits provide the hardness of electroless nickel and the lubricity of PTFE or boron nitride. The incorporation of PTFE particles provides dry lubrication and improved release properties. Some applications include plating molds and dies, self-lubrication for electronics, and other sensitive equipment, and low friction wear against mated surfaces. The incorporation of boron nitride particles improves the sliding friction characteristics of electroless nickel. EN/BN deposits can withstand higher abrasion forces and higher temperatures compared to EN/PTFE.
EN/PTFE and EN/BN are both porous deposits, which provide poor corrosion resistance. This study investigates whether or not the codeposition overlayer improves, decreases or has any effect on the corrosion resistance of the high phosphorus base layer when compared to a single layer of high phosphorus electroless nickel. Varying amounts of codeposited particles and varying layer thicknesses are explored.
Electroless Nickel Systems
The base layer for the duplex coatings consisted of a RoHS-compliant high phosphorus deposit of approximately 10.1-10.3 wt% P. The high phosphorus plated at 0.37-0.43 mil/hr (9-11 µm/hr). The EN/PTFE layer was plated to various PTFE compositions: 2-3, 6-7 and 10-11 wt%. All EN/PTFE baths had a plating rate of approximately 0.3 mil/hr (7.5 µm/hr). The high phosphorus matrix for the EN/PTFE was the same system used for the base layer. The EN/BN deposit was generated from a low/mid-phosphorus RoHS-complaint electroless nickel bath with a hexagonal boron nitride dispersion with low-to-moderate mechanical agitation to keep the particles suspended in solution and in constant motion. The EN/BN deposits plated at a rate of 0.6-0.7 mil/hr (15-18 µm/hr).
The surface topography of the high phosphorus EN used as a base layer for all testing is shown in Fig. 1. It is a smooth, pit-free deposit. The low porosity helps to establish a good base for the subsequent layers.
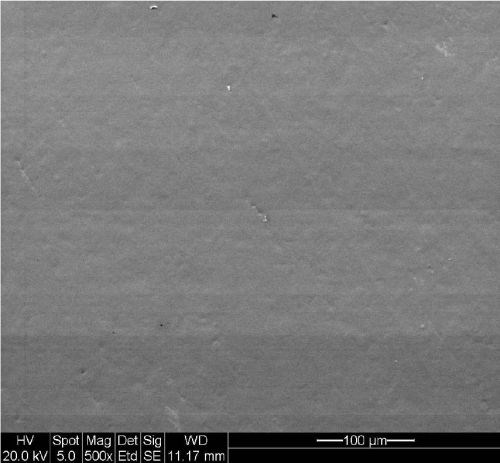
Figure 1 - Surface of high-phosphorus electroless nickel (500× magnification).
Figure 2 features magnified SEM pictures of the surface of the electroless nickel/PTFE codepositions at various weight percentages of PTFE. The dark spots indicate PTFE particles. They are evenly dispersed across the deposit. As the amount of codeposited PTFE decreases, fewer particles are codeposited and this creates a higher coefficient of friction. The codeposited particles have a particle size of 260-280 nm.
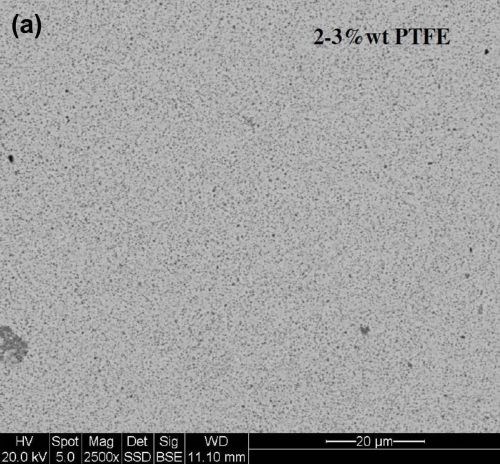
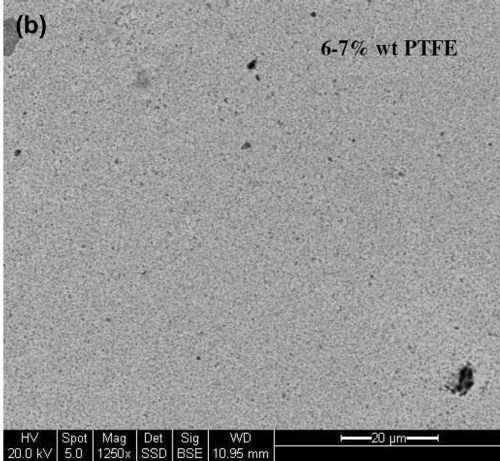
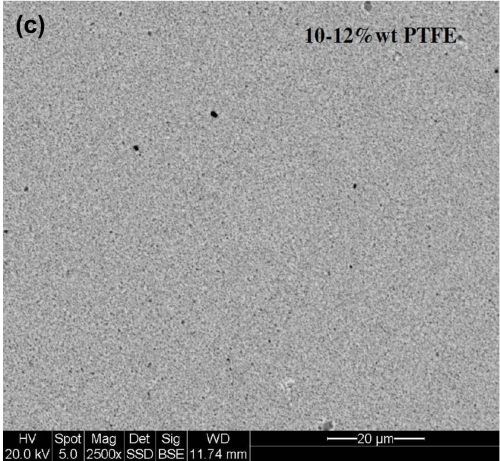
Figure 2 - Surface SEM photos of EN/PTFE deposits at (a) 2-3 wt%, (b) 6-7 wt% and (c) 10-12 wt% PTFE.
Figure 3 shows the magnified SEM photo of the electroless nickel/boron codeposit. Again the dark areas are codeposited particles, but in this case, they are boron nitride particles. It is evident that the boron nitride particles have a higher average particle size. The particle size of the boron nitride ranges from 800-1,000 nm (0.8-1.0 µm). The volume percent boron nitride codeposited is 8.9 vol%.
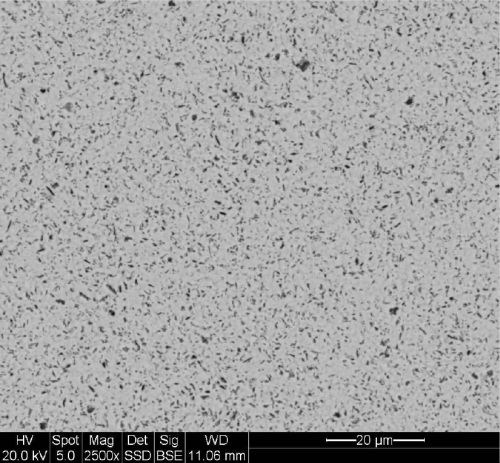
Figure 3 - Magnified surface photo of EN/BN deposit with 8.9 vol% boron nitride.
Test Parameters
Test panels were pre-treated and plated on a small scale production line. The high phosphorus EN was plated in a 15-gal stainless steel tank with 5 µm filtration. The panels were rinsed briefly with deionized water before transferring to the next tank (either PTFE or BN, 10-gal polypropylene tank) to plate the lower coefficient overlayer. All panels were 3 × 6 inches, plated in triplicate, edges stopped off, and placed in NSS as plated. Both steel and aluminum panels were plated for most sets. Steel panels were unpolished cold rolled steel (CRS) from ACT (Hillsdale, MI). The pretreatment for steel was as follows: soak cleaner, rinse, electrocleaner, rinse, 50% HCl activation, rinse, EN. Alloy 6061 T6 aluminum panels were purchased from ACT and were pretreated with alkaline cleaner, rinse, tri-acid etch, rinse, zincated (1 min), 50% nitric acid, rinse, zincate (30 sec), rinse, EN. Rate panels were plated along with each set of panels to obtain the plating rate and for %PTFE and %BN analysis. All EN baths were run at the optimal temperature and pH according to their technical data sheets.
All panels were tested in accordance with ASTM B117.2 The test features a 5% chloride electrolyte at an elevated temperature and utilizes a fine-fog mist. Salt spray results provide an evaluation of corrosion protection for each deposit (i.e., the ability to protect the substrate), and it also helps to show the overall porosity of coatings. Panels in NSS were checked for corrosion sites daily. The NSS results are reported as an average of the three panels per set. Panels that reached 2,000 hrs without corrosion were removed from the cabinet and 2,000 hrs was recorded for each panel for averaging purposes.
Results
EN/PTFE and EN/BN without base layers
Figure 4 shows the NSS results for the EN/PTFE deposits at 2-3, 6-7 and 10-11 wt% PTFE and the EN/BN (2-3 wt% BN) deposit at a thickness of 0.2 mil (5 µm) without a high phosphorus base layer. The lower coefficient of friction deposits do not survive a long time in NSS due to the porous nature of the deposits. In fact, the higher the wt% PTFE in the deposit, the more porous the layer and the less corrosion resistance it has. The 2-3 wt% PTFE deposits provided over 150 hrs in NSS before failure. This result is significantly better than the 24-48 hr provided by the 10-11 wt% PTFE deposit.
The NSS results for the boron nitride deposit are surprisingly similar to the 10-11 wt% PTFE deposit. Even the though the deposit has fewer embedded particles, the particles are about four times larger than the PTFE. This could allow the NaCl electrolyte to cover a larger area around the individual particles, which could allow additional corrosion routes to the substrate to develop. Also, the EN/BN deposit is based on a low/mid- phosphorus process, which has lower corrosion resistance when compared to high phosphorus EN.
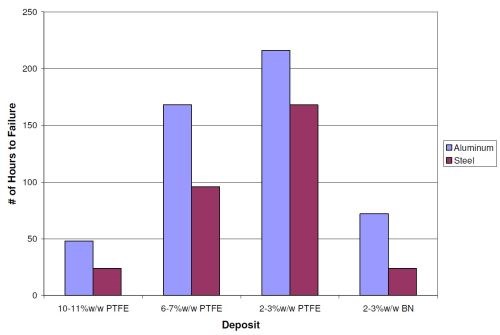
Figure 4 - Neutral salt spray results for codeposition deposits of PTFE and BN at various weight percentages at a thickness of 0.2 mil (5 µm) without a high phosphorus base layer.
Would a thicker layer of EN/PTFE or EN/BN produce better NSS results? Figure 5 shows the NSS results for the lower coefficient of friction layers without a base layer of high phosphorus at a thickness of 0.2 mil (5 µm) and 0.5 mil (12.5 µm) on cold rolled steel panels. Increasing the lower coefficient of friction layer thickness does not improve the NSS results. The nature / structure of the deposits does not change with an increase in thickness. The 10-11 wt% PTFE deposit lasts 24 hrs whether it is 0.2 or 0.5 mil thick. The 6-7 wt% and 2-3 wt% PTFE deposits actually show slightly worse results. Further testing at lower (<5 µm) and higher (>12.5 µm) overlayer thickness needs to be performed to determine if the downward trend in the NSS results with higher EN/PTFE thickness continues. The 2-3 wt% BN deposit only did marginally better with the thicker deposit (lasting 24 hrs versus 48 hrs).
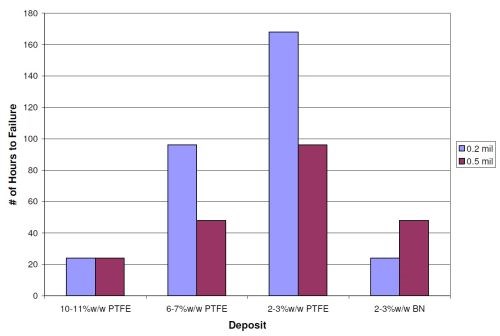
Figure 5 - Neutral salt spray results for EN/PTFE and EN/BN deposits at 0.2 and 0.5 mil thickness without a high phosphorus base layer on steel.
Figure 6 shows the 0.2 mil and 0.5 mil EN/PTFE layer deposits after failure in NSS on steel panels. As stated earlier, the EN/PTFE deposits are porous. However, the less PTFE codeposited, the better the NSS results (without a base layer).
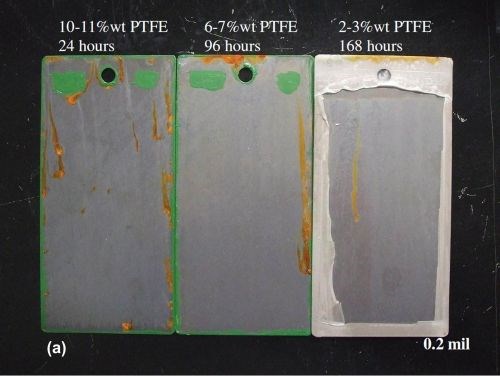
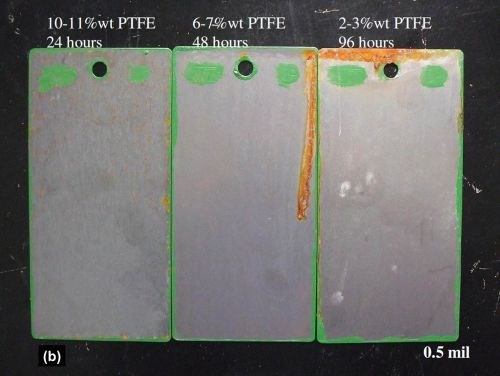
Figure 6 - Neutral salt spray panels of EN/PTFE layers at (a) 0.2 and (b) 0.5 mil thickness after failure.
High phosphorus electroless nickel
The NSS results for 0.2, 0.5, 0.8 and 1.0 mil high phosphorus deposits are shown in Fig. 7. The results are an average of six panels for each set (three CRS and three aluminum). The thicker the deposit, the more corrosion protection is provided. The 1.0-mil deposit survived over 1,600 hrs in NSS before the first corrosion site. The 0.5-mil high phosphorus panels lasted over 1000 hr, and the 0.2 mil deposit endured over 500 hrs before corroding. These high phosphorus NSS values will be compared to base layer deposits of the same thickness but with EN/PTFE and EN/BN overlayers, to determine if the overlayers help or hinder the corrosion protection of the overall duplex coating.
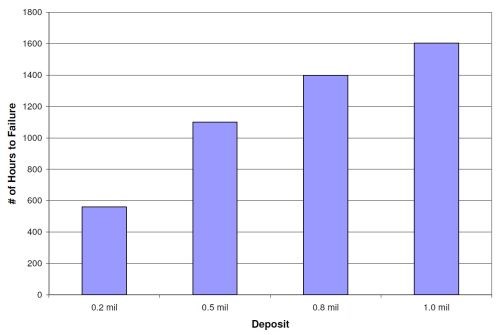
Figure 7 - Neutral salt spray results for high phosphorus electroless nickel at various thicknesses.
The average NSS results for steel panels with 0.5-mil high phosphorus electroless nickel and 0.5-mil EN/PTFE (of various wt% PTFE) and EN/BN overlayers are shown in Fig. 8. The 0.5 mil high phosphorus (HP) deposit lasted 1100 hr as a single layer. The addition of 0.5 mil of 10-11 wt% PTFE and 2-3 wt% BN did not significantly change the NSS results. Both showed NSS results of over approximately 1100 hr. The 0.5-mil overlayers of 6-7 wt% PTFE and 2-3 wt% PTFE provided NSS results of 756 and 764 hrs, respectively. Thus a reduction in the NSS values occurred with the lower wt% PTFE deposits, which have higher coefficient of friction values compared to the 10-11 wt% PTFE.
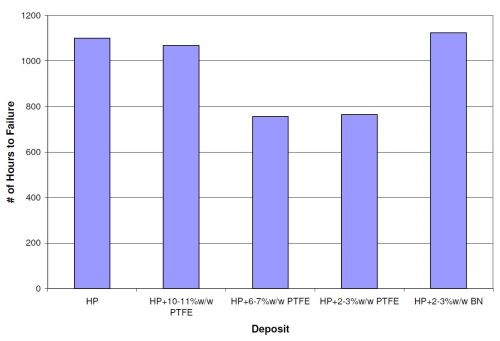
Figure 8 - Neutral salt spray results for duplex coatings comprised of 0.5 mil high phosphorus electroless nickel and 0.5 mil codeposited PTFE or boron nitride overlayers.
Figure 9 shows the results (number of hours to failure) of a duplex coating of 0.8 mil (20 µm) high phosphorus electroless nickel and a 0.2-mil (5-µm) EN/PTFE and EN/BN overlayer. The values are the average of all six panels from each set (three steel and three aluminum). The 0.8-mil high phosphorus layer provided 1,400 hrs in NSS before failure. All deposits with 0.2 mil EN/PTFE as an overlayer survived more than 1,400 hrs. The best result was 1,700 hrs with the 0.8-mil high phosphorus EN plus 0.2 mil 10-11 wt% PTFE overlayer. The duplex coating with 0.2 mil of EN/BN as the overlayer averaged 1,288 hrs in NSS, which is slightly less than the 1,400 hrs obtained with just the high phosphorus base layer.
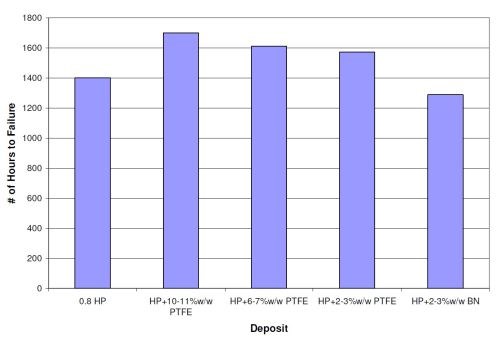
Figure 9 - Duplex coating results for 0.8-mil high phosphorus electroless nickel with a 0.2-mil overlayer of EN/PTFE or EN/BN.
Figure 10 features the same results as provided in Fig. 9, but separated into the averages for the steel and aluminum substrates. The high phosphorus EN on steel provided a little over 1,000 hrs in NSS before failure. This data set had one obvious outlier, which if removed brings the average up to 1,456 hrs. The 0.8-mil high phosphorus EN on aluminum lasted 1,760 hrs. The average of 1,400 hrs for the high phosphorus layer at 0.8-mil thickness skews the data in Fig. 9. Looking at just the steel results, all the duplex coatings lasted longer in NSS compared to the high phosphorus single layer, even with the outlier removed.
However, when comparing the results on aluminum, the trends are different. The duplex coatings with 0.2 mil 10-11 wt% PTFE and 6-7 wt% PTFE survived 1,760 and 1,704 hrs, respectively, before their first corrosion sites were reported. These deposits showed no significant difference with the high phosphorus single layer. The 2-3 wt% PTFE and 2-3 wt% BN overlayers showed slightly lower results of 1,520 and 1,112 hrs, respectively.
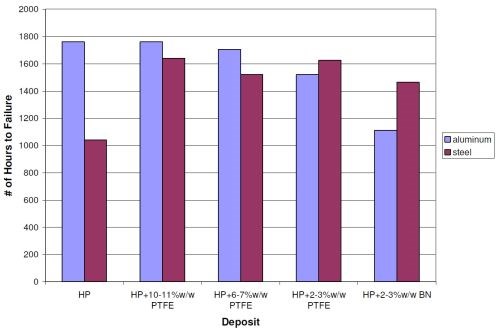
Figure 10 - Steel and aluminum panel results for 0.8-mil high phosphorus EN with an overlayer of 0.2-mil EN/PTFE and EN/BN.
Conclusions/Summary
EN/PTFE and EN/BN are very porous deposits that do not provide good corrosion protection without a superior corrosion-resistant electroless nickel underlayer. Regardless of the thickness of the EN/PTFE and EN/BN single layers, the number of hours to NSS failure are usually less than 100 hr. The more PTFE codeposited, the fewer number of hours the deposit survived in NSS. The more particles, the more possible corrosion routes to the substrate, the more porous the deposit.
With the duplex coatings, the addition of an overlayer of a lower coefficient of friction deposit did not seem to reduce the corrosion protection provided by the high phosphorus underlayer. With 0.8-mil high phosphorus and 0.2-mil EN/PTFE or EN/BN deposits, the 10-11 wt% PTFE and 6-7 wt% PTFE deposits (which have the lowest coefficient of friction values) had results similar to the single layer high phosphorus deposit on aluminum. The 2-3 wt% PTFE and BN deposits did slightly worse than the single layer high phosphorus.
When comparing these results to the results for the 0.5-mil high phosphorus deposit with 0.5-mil EN/PTFE or EN/BN overlayer, there are a few differences. In this case, the EN/BN and 10-11 wt% PTFE deposits as overlayers have comparable results to the single layer high phosphorus deposit. The 0.5-mil 6-7 wt% PTFE and 2-3 wt% PTFE deposits have slightly lower results. Overall, as an overlayer, the 10-11 wt% PTFE deposits give the best overall (comparable to the high phosphorus EN single layer) results regardless of the thickness of the underlayer. The EN/BN as an overlayer seems to perform better with increasing thickness, which is expected with a less corrosion resistant supporting EN matrix. The lower wt% PTFE deposits (6-7 wt% PTFE and 2-3 wt% PTFE) as overlayers have good results but with thinner deposits and thicker underlayers.
Further Work
Further studies need to be conducted. The use of a sulfamate nickel strike as the underlayer rather than high phosphorus nickel should be explored. Ten to eleven percent EN/PTFE layers thinner than 5 µm should be tested to determine the minimum overlayer thickness that can provide similar or improved NSS results.
References
1. N. Micyus, et al., “Electroless Nickel Duplex Coatings Using RoHS-Compliant Systems,” in Proc. AESF SUR/FIN 2011, Rosemont, IL, NASF, Washington, DC (2011); and NASF Report in Products Finishing, Summary: 76 (3), 18 (December 2011); Full Paper: http://www.pfonline.com/articles/electroless-nickel-duplex-coatings-using-rohs-compliant-systems.
2. ASTM B117, 2007a, “Standard Practice for Operating Salt Spray (Fog) Apparatus,” ASTM International, W. Conshohocken, PA.
Related Content
Connect, Collaborate and Contribute to the Industry at SUR/FIN 2024
Atlanta, Georgia, is the home to this year’s NASF SUR/FIN conference and trade show.
Read MoreElectroplating in the Context of Worldwide Nanotechnology Initiatives: A Heritage Paper
In the first part, a summary is presented on recently established nanotechnology initiatives in various countries around the world. Program funding levels and core activities will be compared to provide a basis for assessing business opportunities for various industries. The second part of the paper looks at specific examples of nanostructures made by electrochemical methods currently at various stages in their development, or already in use.
Read MoreNASF/AESF Foundation Research Project #121: Development of a Sustainability Metrics System and a Technical Solution Method for Sustainable Metal Finishing - 15th Quarterly Report
This NASF-AESF Foundation research project report covers the twelfth quarter of project work (October-December 2023) at Wayne State University in Detroit. In this period, our main effort focused on the development of a set of Digital Twins (DTs) using the Physics-Informed Neural Network (PINN) technology with application on parts rinsing simulation.
Read MoreCalculating Applied Media Force During Vibratory Finishing
What appear to be identically set-up vibratory bowls will finish identical loads of parts in varying time cycles. This paper offers a new technique to better predict what the operator will produce, by measuring the force applied to the parts. It is the efficiency of that force which controls the efficiency and speed of the refinement cycle.
Read MoreRead Next
Masking Solutions for Medical Applications
According to Custom Fabricating and Supplies, a cleanroom is ideal for converting, die cutting, laminating, slitting, packaging and assembly of medical-grade products.
Read MoreDelivering Increased Benefits to Greenhouse Films
Baystar's Borstar technology is helping customers deliver better, more reliable production methods to greenhouse agriculture.
Read MoreEpisode 45: An Interview with Chandler Mancuso, MacDermid Envio Solutions
Chandler Mancuso, technical director with MacDermid Envio discusses updating your wastewater treatment system and implementing materials recycling solutions to increase efficiencies, control costs and reduce environmental impact.
Read More












.jpg;maxWidth=300;quality=90)


