NASF/AESF Foundation Research Project #121: Development of a Sustainability Metrics System and a Technical Solution Method for Sustainable Metal Finishing: 3rd Quarterly Report
This report covers the third quarter of project work (October-December 2020) on this project at Wayne State University in Detroit. The objective is to help metal finishing plants to conduct a self-managed sustainability assessment and identify technical solutions for sustainability performance improvement. The reader is invited to contact Dr. Huang in identifying plating shops willing to participate in this program.
by
Yinlun Huang*
Department of Chemical Engineering and Materials Science
Wayne State University
Detroit, Michigan, USA
Editor’s Note: This NASF-AESF Foundation research project report covers the third quarter of project work (October-December 2020) at Wayne State University in Detroit. A printable PDF version of this report is available by clicking HERE.
Overview
It is widely recognized in many industries that sustainability is a key driver of innovation. Numerous companies, especially large ones that made sustainability as a goal, are achieving clearly more competitive advantage. The metal finishing industry, however, is clearly behind others in response to the challenging needs for sustainable development.
This research project aims to:
- Create a metal-finishing-specific sustainability metrics system, which will contain sets of indicators for measuring economic, environmental and social sustainability,
- Develop a general and effective method for systematically sustainability assessment of any metal finishing facility that could have multiple production lines, and for estimating the capacities of technologies for sustainability performance improvement,
- Develop a sustainability-oriented strategy analysis method that can be used to analyze sustainability assessment results, identify and rank weaknesses in the economic, environmental, and social categories, and then evaluate technical options for performance improvement and profitability assurance in plants, and
- Introduce the sustainability metrics system and methods for sustainability assessment and strategy analysis to the industry.
This will help metal finishing facilities to conduct a self-managed sustainability assessment as well as identify technical solutions for sustainability performance improvement.
Progress Report (Quarter 3)
1. Student participation
Since September 2020, Abdurrafay Siddiqui, a newly hired Ph.D. student, has been guided by the P.I. to work on the project. His research activities are reflected in Section 3 of this report.
2. Scheduled project tasks for Quarter 3
The main technical tasks for this quarter are listed below:
- Identification of the parameters needed for quantifying the indicators in Sets A and B.
- Development of new sustainability indicators based on the 12 newly added inspects.
- Initiation of the development of a mathematical method using an enhanced sustainability metrics system (for both conventional and advanced sustainability assessments).
3. Project activities and progress
3.1 Identification of the parameters needed for quantifying the indicators in Sets A and B
The 2nd Quarterly Report listed 53 sustainability indicators that were divided into two sets, Set A (called the minimum set) and Set B (called the extended set). The classification of these indicators is summarized in Table 1.
Table 1 - Summary of sustainability indicators in different categories.

In sustainability assessment, each sustainability indicator needs to be evaluated by usually using more than one type of parameter data. These parameters could be divided into at least six types: (1) plant design data, (2) operational data, (3) production and product data, (4) EHS (environmental, health and safety) data, (5) cost/accounting data and (6) business and management data.
3.1.1 Parameterization of indicators in Set A.
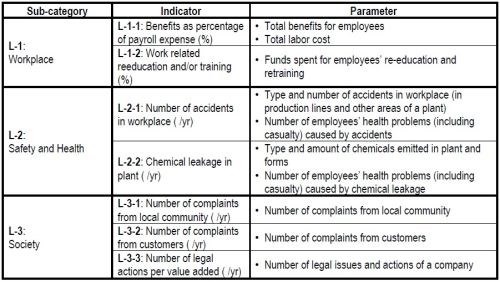
The parameterization of 31 indicators in this set is summarized in Tables 2 to 4. In each table, there is a column named “Parameter”. The parameters listed for evaluation of each specific indicator are only those not appearing in the parameters already listed for the preceding indicators, in order to avoid repeat listing. For instance, the parameter, “Revenue from sales of products before tax”, is already listed for indicator E-1-1. Although this parameter is also needed for indicator E-1-3, it is not shown for this indicator.
Table 2 - Economic sustainability indicators and parameterization in Set A.

Table 3 - Environmental sustainability indicators and parameterization in Set A.

Table 4 - Social sustainability indicators and parameterization in Set A.
3.1.2 Parameterization of indicators in Set B
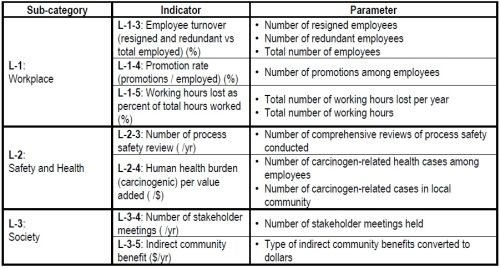
The parameters needed to evaluate 22 indicators in Set B are listed in Tables 5 to 7. Note that many indicators in this set are very similar to those in Set A, except for the difference in evaluation basis. For instance, E-1-5 in Set B is evaluated per direct employee; V-1-4 in Set B counts per dollar of product sales rather than per value added for V-1-1 in Set A. It is possible that some plants may select some indicators in Set B rather than Set A, or possibly both.
Table 5 - Economic sustainability indicators and parameterization in Set B.
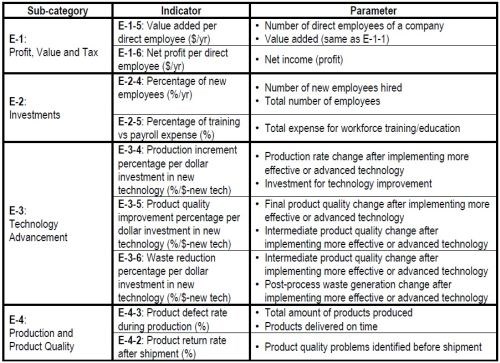
Table 6 - Environmental sustainability indicators and parameterization in Set B.
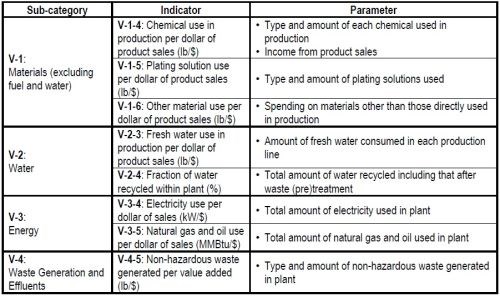
Table 7 - Social sustainability indicators and parameterization in Set B.
3.1.3 Development of new sustainability indicators based on the 12 newly added inspects
The COVID-19 pandemic has ushered in various unprecedented challenges and severely disrupted economic and social systems worldwide. In the U.S., one of the hardest-hit segments by the pandemic is the manufacturing industry, especially small businesses like the metal finishing industry. Health risks, demand reduction, supply chain disruption, etc. have slowed numerous manufacturing facilities to a standstill. After one year of pandemic outbreak, it is still unpredictable today when the coronavirus will die down. The metal finishing industry, like other manufacturing industries, needs to look beyond the fog of uncertainty towards long-term changes and develop strategies for more sustainable and resilient development in the future. Therefore, extended sustainability assessment is needed for the industries.
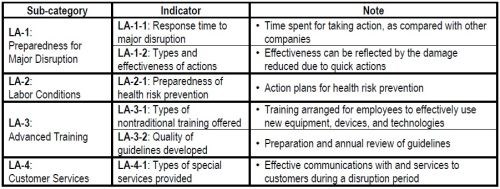
In the last report, the PI reported his initial research on how to make sustainability assessment more comprehensive, and described 12 new aspects that need to be added to more traditional metrics systems. The research was published in a special issue on “Smart and Sustainable Manufacturing in the Post COVID-19 Manufacturing Era” by ASTM journal - Smart and Sustainable Manufacturing Systems (Huang, 2020). In this quarter, a number of sustainability indicators covering the 12 new aspects are identified, which are listed in Tables 7 to 10. Note that these indicators need to be refined in the following months. Possibly, additional indicators will be introduced.
Table 8 - Non-traditional economic sustainability indicators.
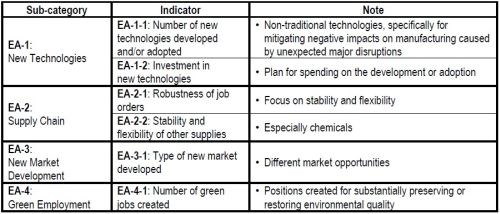
Table 9 - Non-traditional environmental sustainability indicators.
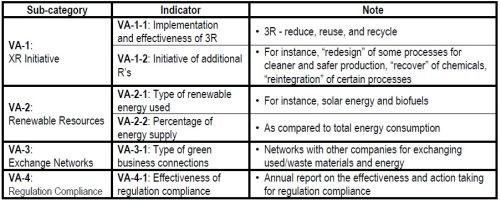
Table 10 - Non-traditional social sustainability indicators.
3.1.4 Initiation of the development of a mathematical method using the enhanced sustainability metrics system
The indicators selected from the tables in the last section will be used to assess sustainability performance of a company or even the electroplating sector. Figure 1 shows a spider chart to be used as a scheme to present the results of indicator evaluations, where all indicator values are normalized to the range of 0 to 1, with 1 the best. This type of result presentation can provide a visually clear comparison of the system under different conditions.
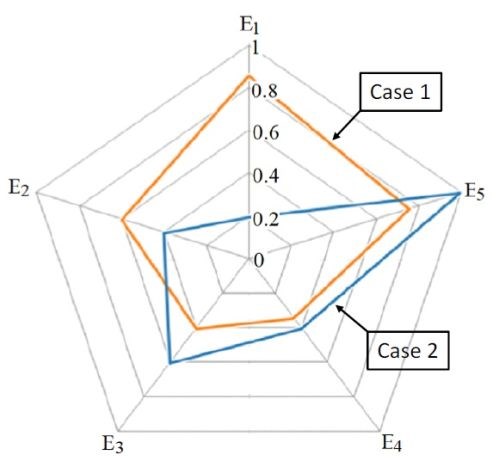
Figure 1 - Spider chart to present the economic sustainability assessment results by five individual indicators for two cases.
To aggregate assessment results by individual indicators, we will use the following three formulas:

where E, V and L are the evaluation results of the economic, environmental and social sustainability, respectively; Ei, Vj and Lk are individual normalized indicators in different sustainability categories; NE, NV and NL are the total numbers of selected indicators in different sustainability categories; ai, bj and ck are weighting factors associated with different indicators, taking values between 1 and 10, with 10 as the most important and 1 as the least.
The overall sustainability performance of a plant or even an industrial sector, S, will be evaluated using the composite indices, E, V and L, i.e.,

where α, β and γ are weighting factors in the range of 1 to 10. Because E, V and L are normalized, S is also normalized between 0 (completely unsustainable) and 1 (completely sustainable).
Note that the above formulas contain a large number of weighting factors that reflect the different relative importance versus other indicators as well as other sustainability categories. With few exceptions, the values of weighting factors cannot be scientifically and uniquely determined. Note that different weighting factor values will generate different assessment results, some of which could be misleading. Thus, weighting factor selection has been a major challenge in sustainability assessment.
Our comprehensive literature survey has led to identification of a scientific method, namely the Analytic Hierarchy Process (AHP) method, which was developed by Thomas Saaty, a member of US National Academy of Engineering (Saaty, 1980, 2008). This method has been widely used in industries for decision making in complex scenarios. In this method, Saaty introduced a rating scale. Decision-making participants can use the scale to give weights for key factors based on their own experience and judgement. Then a scientifically rigorous mathematical method is employed to calculate a consistency ratio to measure how consistent the judgements have been relative to large samples of purely random judgements. Under the PI’s guidance, the Ph.D. student working on this project has been initially successful in determining weighting factors for a group of sustainability indicators (Siddiqui, 2020). An internal report on this progress is under review. We will formulate the weighting factor determination process, and test it using some case study problem. If successful, we plan to report this research work in the next quarterly report.
4. Plan for the 5th quarter of the project (1/1/21 – 3/31/21)
The sustainability indicators in Sets A and B will be continuously refined. However, the most important factor is to have industrial experts engaged in the review process. Thus, in the next quarter, the PI will develop a document about the sustainability metrics system and a guideline for the evaluation of the metrics system. In addition, the PI will seek collaboration with some electroplating facilities who may provide case studies for testing the metrics system.
As planned, the PI’s team will formally initiate the development of a sustainability assessment method. The primary focus will be on the development of an AHP-based methodology to systematically determine weighting factors associated with indicators. Case studies will be used to test the method.
5. References
1. Huang, Y., “Reinforcing Sustainability Assessment and Reshaping Technology Innovation for Highly Sustainable Manufacturing in the Post–COVID-19 Era”, Smart and Sustainable Manufacturing Systems, 4 (3), 341-345 (2020).
2. T.L. Saaty, The Analytic Hierarchy Process: Planning, Priority Setting, Resource Allocation, McGraw-Hill, New York, 1980.
3. T.L. Saaty, T. L., “The analytic hierarchy and analytic network measurement processes: applications to decisions under risk,” European J. of Pure and Applied Mathematics, 1 (1), 122-196 (2008).
4. A. Siddiqui, Sample Calculations for the Overall Sustainability of an Electroplating Company by the Analytic Hierarchy Method, Internal Progress Report, Laboratory for Multiscale Complex Systems Science and Engineering, Department of Chemical Engineering and Materials Science, Wayne State University, Detroit, MI, Dec. 26, 2020.
6. Past project reports
1. Quarter 1 (April-June 2020): Summary: NASF Report in Products Finishing; NASF Surface Technology White Papers, 84 (12), 14 (September 2020); Full paper: http://short.pfonline.com/NASF20Sep1
2. Quarter 2 (July September 2020): Summary: NASF Report in Products Finishing; NASF Surface Technology White Papers, 85 (3), 13 (December 2020); Full paper: http://short.pfonline.com/NASF20Dec1
7. About the author

Dr. Yinlun Huang is a Professor at Wayne State University (Detroit, Michigan) in the Department of Chemical Engineering and Materials Science. He is Director of the Laboratory for Multiscale Complex Systems Science and Engineering, the Chemical Engineering and Materials Science Graduate Programs and the Sustainable Engineering Graduate Certificate Program, in the College of Engineering. He has ably mentored many students, both Graduate and Undergraduate, during his work at Wayne State.
He holds a Bachelor of Science degree (1982) from Zhejiang University (Hangzhou, Zhejiang Province, China), and M.S. (1988) and Ph.D. (1992) degrees from Kansas State University (Manhattan, Kansas). He then joined the University of Texas at Austin as a postdoctoral research fellow (1992). In 1993, he joined Wayne State University as Assistant Professor, eventually becoming Full Professor from 2002 to the present. He has authored or co-authored over 220 publications since 1988, a number of which have been the recipient of awards over the years.
His research interests include multiscale complex systems; sustainability science; integrated material, product and process design and manufacturing; computational multifunctional nano-material development and manufacturing; and multiscale information processing and computational methods.
He has served in many editorial capacities on various journals, as Co-Editor of the ASTM Journal of Smart and Sustainable Manufacturing Systems, Associate Editor of Frontiers in Chemical Engineering, Guest Editor or member of the Editorial Board, including the ACS Sustainable Chemistry and Engineering, Chinese Journal of Chemical Engineering, the Journal of Clean Technologies and Environmental Policy, the Journal of Nano Energy and Power Research. In particular, he was a member of the Editorial Board of the AESF-published Journal of Applied Surface Finishing during the years of its publication (2006-2008).
He has served the AESF and NASF in many capacities, including the AESF Board of Directors during the transition period from the AESF to the NASF. He served as Board of Directors liaison to the AESF Research Board and was a member of the AESF Research and Publications Boards, as well as the Pollution Prevention Committee. With the NASF, he served as a member of the Board of Trustees of the AESF Foundation. He has also been active in the American Chemical Society (ACS) and the American Institute of Chemical Engineers (AIChE).
He was the 2013 Recipient of the NASF William Blum Scientific Achievement Award and delivered the William Blum Memorial Lecture at SUR/FIN 2014 in Cleveland, Ohio. He was elected AIChE Fellow in 2014 and NASF Fellow in 2017. He was a Fulbright Scholar in 2008 and has been a Visiting Professor at many institutions, including the Technical University of Berlin and Tsinghua University in China. His many other awards include the AIChE Research Excellence in Sustainable Engineering Award (2010), AIChE Sustainable Engineering Education Award (2016), the Michigan Green Chemistry Governor’s Award (2009) and several awards for teaching and graduate mentoring from Wayne State University, and Wayne State University’s Charles H. Gershenson Distinguished Faculty Fellow Award.
* Corresponding author:
Dr. Yinlun Huang, Professor
Dept. of Chemical Engineering and Materials Science
Wayne State University
Detroit, MI 48202
Office: (313) 577-3771
E-mail: yhuang@wayne.edu
Related Content
Electroplating in the Context of Worldwide Nanotechnology Initiatives: A Heritage Paper
In the first part, a summary is presented on recently established nanotechnology initiatives in various countries around the world. Program funding levels and core activities will be compared to provide a basis for assessing business opportunities for various industries. The second part of the paper looks at specific examples of nanostructures made by electrochemical methods currently at various stages in their development, or already in use.
Read MoreHexavalent-Chromium-Free Aluminum Sacrificial Paint Validation
Hexavalent chromium is a known carcinogen, repro-toxin and mutagen. Its elimination is of high importance to the aerospace industry, which has struggled to find high performing alternatives. Legacy aluminum sacrificial paints have traditionally utilized hexavalent chromium to prevent corrosion and coatings which are equal to or better than have been difficult. This second of two papers discusses the hexavalent-chromium-free process from the user point-of-view in terms of the process validation work by Rolls Royce Corporation.
Read MoreOSHA, DOT and EPA Penalties Increase for 2023
The Department of Labor to revise civil penalty amounts for employer OSHA violations.
Read MoreNASF's SUR/FIN 2023: Bringing the Surface Finishing Industry Together
SUR/FIN 2023 is an opportunity for those in the surface finishing industry to expand their knowledge, expertise and network.
Read MoreRead Next
Delivering Increased Benefits to Greenhouse Films
Baystar's Borstar technology is helping customers deliver better, more reliable production methods to greenhouse agriculture.
Read MoreEpisode 45: An Interview with Chandler Mancuso, MacDermid Envio Solutions
Chandler Mancuso, technical director with MacDermid Envio discusses updating your wastewater treatment system and implementing materials recycling solutions to increase efficiencies, control costs and reduce environmental impact.
Read MoreEducation Bringing Cleaning to Machining
Debuting new speakers and cleaning technology content during this half-day workshop co-located with IMTS 2024.
Read More


.jpg;maxWidth=300;quality=90)


