Current Distribution on Microprofiles - The 14th William Blum Lecture - Part 2
This article is the second of four parts of a re-publication of the 14th William Blum Lecture, presented at the 60th AES Annual Convention in Cleveland, on June 18, 1973. Dr. Otto Kardos gives a comprehensive discussion of how the deposit forms on surface textures, and how leveling and brightness are achieved.
by
Otto Kardos
M&T Chemicals
Ferndale, Michigan
Recipient of the 1972 William Blum
AES Scientific Achievement Award
Editor’s Note: Originally published as Plating, 61 (3), 229-237 (1974), this article is the second of four parts of a re-publication of the 14th William Blum Lecture, presented at the 60th AES Annual Convention in Cleveland, on June 18, 1973.
A printable PDF version of Part 2 is available by clicking HERE.
The printable PDF version of the complete 52-page paper is available HERE.
6. The definition of microprofiles and the meaning of mass transport control
A “typical” microprofile is sufficiently small-scale so that (1) the electrode potential E is practically uniform over the profile, and (2) the effective thickness of the diffusion layer δN varies over the profile.
The variation of δN leads to a variation of local current density if the metal deposition is, at least partly, controlled by the mass transport (mass transfer, or shorter and more familiar, diffusion) of the depositing metal ions or of an addition agent.
In absence of diffusion control, different orientation of crystal facets, or the presence of lattice dislocations, grain boundaries, impurities, etc., may cause a variation of the polarization parameter kc, and more particularly of i0 and perhaps αc, over the profile, but these influences will be rather random, not systematic, between micropeaks and microrecesses, except to some extent on microprofiles produced by electrodeposition. Wagner83 gave a basic analysis of the effects of a variation of the polarization parameter kc over an electrode.
If diffusion control is absent and if crystallographic differences can be neglected, the practical uniformity of the electrode potential over a microprofile leads from Equations (10) to (12) to practical uniformity of the current density.
If the metal deposition rate is controlled by the diffusion rate of an inhibitor, but not by the diffusion rate of the metal ions, one may still apply Equations (10) to (12) for activation overvoltage, if one replaces i by i/(1 - θ), where θ is the fractional surface coverage by the inhibitor. This modification of the equations is based on the simplifying assumption that the inhibiting action consists in a mere reduction of the surface area available for deposition and that the cathodic transfer coefficient αc is not affected by the inhibitor. Then the practical constancy of E, and consequently of ηact, over the microprofile leads to a practical constancy of i/(l - θ) and to ir/ip (l - θr)/(l - θp). Compare Ref. 78.
If, on the other hand, the metal deposition rate is controlled by the mass transfer rate of the depositing metal ions then the Nernst equation for concentration polarization applies:
(19)
where n is the valency of the depositing metal.
If one neglects a possible variation of the transport number tMe with current density, Eq. (19) may be transformed into:
(20)
If the overpotential can be expressed by this equation, practical constancy of E implies practical constancy of i/iL. Thus, the local current densities would be proportional to the local limiting current densities (which would vary approximately as the current densities in primary current distribution) or, from Eq. (16) inversely proportional to δN.
Although in cyanide baths Equations (19) and (20) would have a more complicated form (see, e.g., p. 174 of Ref. 7) we may use Eq. (20) to demonstrate why concentration polarization tends to throw a deposit into a macroprofile but out of a microprofile.2 Over a macroprofile iL and δN are practically constant. The higher i at a protruding point would thus produce a more negative ηconc, that is, a "greater" cathode polarization, which would oppose current flow to the peak points and tend to throw it into the recess. On micropeaks iL is much greater, or δN much smaller, than on the microrecess points and this would allow a proportional increase of the local current density without creating a local increase of overpotential.
At certain values of i/iL, which will be higher for metals with low exchange current density i0, such as nickel or iron, than for copper, zinc and especially silver (Ref. 35, pp. 17, 125), Eq. (10) has to be abandoned for Eq. (20). Good microthrow and "true" leveling will then be replaced by bad microthrow. If the formation of a diffusion layer of nonuniform thickness is suppressed by the use of interrupted current, good microthrow, but not true leveling, is restored (see Section 11).
Also, on descent into a microgroove, especially if the enclosed angle β is small and the current density medium to high, Eq. (20) may replace Eq. (10) or bad microthrow (hr/hp < 1) replace true leveling (hr/hp > 1) at some point. This may lead to an apparently leveled deposit which contains a void, as shown by Raub in Fig. 9.45 This figure shows also preferential etching in the peak areas due to greater codeposition rates, and an increase of lamination thickness on descent into the microgroove.
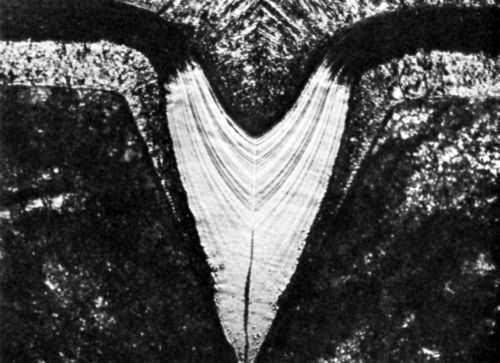
Figure 9 - Photomicrograph of bright nickel deposit; initial groove depth 120 μm; from Raub.45
It is surprising that a "typical" microprofile is defined by two independent criteria, namely Er Ep (from Eq. 3 and 5) and d or a/2 << kc (from Eq. 8 and 9) on the one hand, and a groove width a "not much greater" than 2δ, so that δN varies over the profile, on the other hand. It is still more surprising that the existence of two independent criteria does not complicate the situation particularly.
It was shown in Section 2 that activation overvoltage would, at 3 A/dm2 and on a triangular wave profile of included angle β = 90°, produce practically uniform current distribution if the groove depth or half-width is not larger than about 18 μm in the Watts nickel bath, 36 μm in the regular acid copper bath, and 100 μm in the high-throw acid copper bath.
Mass transport into a microgroove should be hindered if the groove width is about twice the diffusion layer thickness. This critical groove width depends on the profile shape. On cylindrical cavities of a U-shaped cross section and 25 mm deep, cyanide copper, which has a relatively high concentration polarization, gave better throwing power than Watts nickel at diameters equal or greater than 6 mm, but a slightly worse throwing power at a diameter of 3 mm. Also, on the wider cavities agitation reduced the throwing power, whereas it improved it on the 3 mm wide cavity.45 On only 0.084 mm deep trapezoidal grooves the critical groove width was only 0.5 mm.138 With widths greater than 0.5 mm increased concentration polarization (due, e.g., to higher current density or to lower temperature) threw the cyanide copper deposit into the recess, with smaller widths out of it. On current distribution in narrow and deep slots see also Refs. 44, 84-86.
At very high agitation rates and especially with short cathodic current pulses, the diffusion layer becomes very thin and follows the contours of the profile. Then, e.g., in an acid copper bath, bad microthrow and true leveling disappear and concentration polarization helps to throw the deposit into the recess. See Section 11 and Refs. 133, 134, 178.
Why does the variation of the diffusion layer thickness over a microprofile influence current distribution only in presence of, at least partial, mass transport (mass transfer, diffusion) control? What is the meaning of rate control and rate-determining step?
A reaction occurring at the boundary of two phases ("heterogeneous reaction") such as an electrode reaction comprises at least two steps: the transport of the reacting species to the phase boundary and the (physical, chemical, electrochemical) reaction at the phase boundary.
In the case of metal electrodeposition the latter consists of several steps: transfer of the metal ion through the electric double layer (only about 10-7 cm thick as compared to about 10-2 cm for the diffusion layer), surface diffusion of the still partly hydrated and probably still partly charged adatoms or adions to suitable sites for incorporation into the metal lattice, and final incorporation. If surface diffusion is hindered by adsorbed addition agents or impurities, or if the growth sites are blocked, the adatom or adion concentration builds up which leads to formation of new nuclei and thereby of new growth sites. The reduction of multivalent metals occurs generally in several steps, e.g., Cu+2 + e- ⇒ Cu+; Cu+ + e- ⇒ Cu.30,33,38-40,87-90
For addition agents the steps of the reaction sequence are: diffusion to the cathode, adsorption, which for "reversible" adsorption may be partly counterbalanced by desorption of the unchanged additive, consumption of the additive by incorporation (codeposition) in unchanged or changed form and often by reduction (hydrogenation) to a less adsorbable form, which is desorbed into the electrolyte.
In the pre-steady (transition) state, one of the several steps of a multistep reaction generally proceeds at a lower rate than the other, but, when the steady state is reached, all the steps in a consecutive sequence must proceed at the same rate.30,33 Nevertheless, one of these steps is rate-determining in the sense that the overall reaction rate will be most influenced by a change of the rate of this particular step.
Rate-determining steps in a consecutive sequence are very common in daily life. In an organization an idea or process or product may pass through several departments. One of these departments may be the "bottleneck" and, consequently, the passage through it would be the rate determining step. The same may happen at a particular station of a conveyor line.
One may simplify the reaction sequence by dividing it into only two steps: the mass transport to the electrode and the overall reaction at the electrode. This leads to the equation:
(21)
where CE and CB are again the concentrations of the reacting species in the bulk and in vicinity of the electrode; kT, the mass transfer coefficient, is for a neutral species equal to D/δN, for a charged species equal to D/δN (l - tMe); kS is the rate constant of the surface reaction.
Rearrangement of Equation (21) gives
(22)
If the mass transport step is the rate determining step and, consequently, kT << kS, then Eq. (22) gives CE << CB. Equations (14) and (15) show that then an increase of δN reduces the mass transport rate most because the increase of δN cannot be compensated by a corresponding increase of the concentration difference (CB - CE), which is already at its maximum. Thus, sensitivity to agitation is the most important criterion of transport control.
If the surface reaction - or one of its steps - is rate determining and thus kS << kT then, from Eq. (22), CE CB. Instead of "surface reaction control" one also uses the terms "electrochemical," "kinetic," "activation" control.
If kS and kT are of the same order one speaks of "mixed control." For the preceding compare, e.g., Ref. 58.
To express the metal deposition rate in a manner which fits Eqs. (21) and (22) one may formulate the equation:
(23)
where would be the cathodic reaction rate at CE = 1 and ηact = 0. For the meaning of the other symbols see Equations (10) to (13). Equation (23) is valid only if ηact is sufficiently negative so that the anodic partial reaction ia is negligible.
At low ηact, kS is smaller than kT, CE CB, and electrodeposition is under "activation" control. With increasing current density ηact becomes more negative, kS increases exponentially, and becomes first comparable to kT ("mixed control"), and then larger than kT ("transport control") which leads to CE << CB and thus from Eqs. (19) and (20) to preponderant concentration polarization.
The situation is slightly more complicated for the adsorption and consumption of addition agents. One may formulate two equations, (24) and (25).
(24)
where kads and kdes are rate constants for adsorption and reversible desorption of the unchanged addition agent, respectively, and θ is the fractional surface coverage by the addition agent.
The second equation is
(25)
where the subscripts refer to total cathodic consumption, incorporation and reduction (generally hydrogenation on nickel and other metals acting as hydrogenation catalysts), respectively.
The terms kcons, kinc and kred should be proportional to the current density i; kred because the reduction rate of organic levelers should depend on the electrode potential in a similar manner as does the current density. kred should increase with increasing hydrogen ion concentration in vicinity of the cathode. Compare Refs. 10, 48, 64, 66.
Because of the proportionality of kcons, kinc, kred to i, we may write Eq. (25) for the case of transport control (CE << CB) in the form:
(26)
θ would thus increase with increasing kT (increasing agitation, decreasing δN), increasing CB, decreasing i, decreasing k'red, e.g., because of pH increase.
Equation (24) would take the form of Eq. (21) if kdesθ is negligibly small as compared to kadsCE(1 - θ) even at high θ, that is for completely irreversible adsorption. Then one can substitute kads(1 - θ) for kS and obtain again Eq. (21). At low θ and for not too low kads one would have transport control (kT << kS and CE << CB). With increasing θ, kS would become progressively smaller which would first lead to kS kT (mixed control) and finally to kS << kT (surface reaction control). The decrease of kS with increasing θ may be further accelerated because kads may decrease with increasing θ because of mutual repulsion of the adsorbed molecules or because at higher θ only less favorable adsorption sites are available.
The critical values of fractional surface coverage θcrit for the fading away and the final disappearance of transport control by a selected leveler occur at a lower CB for smaller δN (therefore, at lower CB on micropeaks as compared to microrecesses) and, from Eq. (20), for lower current density and often also for higher pH.
If reversible desorption cannot be neglected, a decrease of kS due to increasing surface coverage θ leads to a faster increase of CE towards CB and to a faster disappearance of rate control by the transport of the addition agent.
The action of many, and perhaps all, addition agents is at sufficiently low concentration diffusion controlled. But the critical concentration for the disappearance of diffusion control (at the same kT and i) varies widely depending on kads, kdes, kinc and kred for the various additives. Compare Section 9.
The various combinations of surface reaction control and transport control, which may be symbolized by SC and TC, respectively, for the metal electrodeposition rate and for the action of additives may be summarized in Table 1.

If metal deposition rate and inhibitor action are both transport controlled, the outcome is uncertain. Transport control of the metal deposition rate tends to produce "bad microthrow" or ir/ip < 1, transport control of the inhibitor action tends to produce "true leveling" or ir/ip > 1. At high i/iL ratios for the metal deposition the former influence should prevail, at lower i/iL ratios the latter.
Of course, SC for metal deposition in column 2 or 3 means only that the metal deposition rate is directly surface reaction controlled (kS,Me << kT,Me and CE,Me CB,Me) but indirectly by the transport rate of the inhibitor or stimulator.
And, of course, the presence of at least one TC in columns 2 to 6 means that current density (at constant electrode potential) or electrode potential (at constant current density) depends on the agitation rate or, on microprofiles, on the variation of kT (or δN) over the profile.
7. Leveling maxima
The discovery of leveling maxima by Watson and Edwards3 attracted considerable attention and many plots of leveling vs. addition agent concentration can be found in the literature.3,72,91-93,99,111

Figure 10 - Thickness ratios of nickel deposits vs. coumarin concentrations at various current densities; initial groove depth 60 μm, notch angle 90°, deposit thickness on flat surface 6 μm; from Voronko.91
We show here only two graphs from the less accessible Russian literature. Figure 1091 shows plots of thickness ratios hr/hp against coumarin concentration at various current densities (1 to 6 A/dm2) obtained with 6 μm deposit thickness (on the flat surface) in 60 μm deep V-grooves, with an enclosed angle of 90°, in a Watts nickel bath (50°C, pH = 4, mechanical agitation). The coumarin concentration required for maximum leveling increases with increasing current density; see also Ref. 3. If a certain leveler concentration is smaller than the concentration required for maximum leveling at a selected current density, then decrease of current density will improve leveling; if it is larger than the optimum for a selected current density, increase of current density will often improve leveling (not true in Fig. 10 for increase from 3 to 6 A/dm2). Figure 10 shows a decrease of the maximum leveling obtained with increasing current density. This is partly due to the relatively great depth (60 μm) of the microgroove, so that at higher current density the electrode potential is no longer practically uniform (see Eqs. 3 and 5), partly apparently also to incipient transport control, especially at 6 A/dm2, of the metal deposition rate itself.

Figure 11 - Leveling percentage vs. current density in Watts nickel bath at two coumarin concentrations, (1) 0.09 g/L and (2) 0.5 g/L; initial groove depth 8.3 μm and width 50 μm, deposit thickness on flat surface 3 μm; from Kruglikov, et al.92
Figure 1192 shows plots of leveling percentage against current density for two coumarin concentrations (Curve 1: 90 mg/L = 0.615 mM; Curve 2: 500 mg/L = 3.4 mM) in a Watts nickel bath (50°, pH = 4.1, mechanical agitation) with 3 μm deposit (on the flat) and an initial groove depth of 8.3 μm and groove width of 50 μm. Again, as in Fig. 10, higher current densities require higher leveler concentrations to give maximum leveling. The existence of leveling maxima vs. current density must be considered for the plating of profiled parts, especially because the low current density areas receive, of course, a thinner deposit.
A closer look at Figs. 10 and 11 shows some apparent contradictions between them: decrease of the maximum leveling obtainable with increasing current density in Fig. 10 but not in Fig. 11; higher concentrations required for maximum leveling at 1 to 2 A/dm2 in Fig. 10 (about 2.5 mM = 0.365 g/L coumarin) than in Fig. 11 (0.09 g/L). The first difference is probably explainable by the great difference in profile depth and shape: groove depth 60 μm for Fig. 10, but only 8.3 μm for Fig. 11; width/ depth ratio = 2 for Fig. 10 (because 0 = 90°) and 50/8.3 = 6 for Fig. 11. The much smaller depth of the profiles used for Fig. 11 would - from Eqs. 3 and 5 - minimize the increase of the potential difference Er - Ep with increasing current density, and the relatively wider grooves for Fig. 11 would postpone control by the metal ion transport to higher current densities. Explanation of the different concentrations required for maximum leveling is more difficult. It might be due to the difference in groove shape or agitation rate. DuRose78 found in a Watts nickel bath (60°C, pH = 4.0, 3 A/dm2, mechanical agitation) about 0.75 to 1 g/L coumarin (= 5 to 7 mM) required for maximum leveling in V-shaped grooves (15 to 20 μm deep, 22 to 24 μm wide), but only 0.3 g/L (= 2 mM) on satin surfaces of 0.5 μm AA (arithmetic average) roughness.
Maxima of leveling were also obtained against temperature,92 lower temperature requiring higher coumarin concentration, apparently because of the decrease of the diffusion coefficient D.
Watson and Edwards correctly predicted the concentrations required for maximum leveling from their two sets of polarization curves (E vs. i, and E vs. CB) with the help of Eq. (17).
Raub and Stalzer93 used an interesting, partly galvanostatic, partly potentiostatic method for the prediction of leveling with the help of a cylindrical cathode which was either static or rotating at a selected rpm value. They maintained a constant current density of, e.g., 3 A/dm2 on the non-rotating cylinder throughout the experiment. To give 3 A/dm2 at a certain concentration of the leveling agent C1 a potential E1 was required. Then they measured the lower current density obtained with C1 and at E1 on the rotating electrode, and continued in the same manner with C2 and E2, etc. By plotting the difference in current density (inon-agit - iagit) against concentration they obtained a maximum, which for butynediol in a Watts nickel bath at 3 A/dm2 and 40°C was at about 0.6 g/L butynediol.
This technique should roughly predict the position of the leveling maximum for micropeaks protruding from a flat surface in absence of agitation and at 3 A/dm2. For the prediction of leveling in microgrooves and in the presence of agitation, it should be preferable to keep the current density on the rotating cylinder constant and to proceed otherwise as above.
What is the explanation of the occurrence of leveling maxima? The effective diffusion layer thickness, δN, is n-times smaller on the micropeak than at a selected recess point, and then under transport control from Eq. (15), jL,p = njL,r. But as discussed in Section 6, transport control will diminish at a certain critical surface coverage. This critical surface coverage is reached on the micropeak at a lower bulk concentration, CB, than in the recess because of the greater kT (smaller δN) and the smaller local current density (See Eq. 26). Any further increase of CB will make the ratio of the leveler supply rates to peak and recess, jp/jr, decrease until jp becomes equal to jr and leveling completely disappears (See section 9 and Fig. 15). Obviously, it is not the relative supply rate as such but the related relative surface coverage which leads to the decrease and final disappearance of leveling (See sections 9 and 10).
8. Polarization measurements on the rotating disc electrode
The rotating disk electrode consists of a metal disk, several mm to cm in diameter, rotating around its axis in a horizontal position and facing downward in a cell containing the electrolyte. All surfaces are insulated except the down-facing surface of the disk. See Fig. 11(a).
As the disk rotates, the adjacent liquid acquires the rotational motion of the disk. This flow pattern, which moves liquid horizontally out and away from the center of the disk, requires an upward axial flow to replenish the liquid at the disk surface. The rotating disk electrode is a "uniformly accessible" surface with a constant thickness of the diffusion layer over the entire surface and thus allows exact calculation of the mass transport by convection and diffusion. The theory of the rotating disk electrode was largely created by Levich in 1942.94 Compare also Refs. 52, 57-59A, 95.
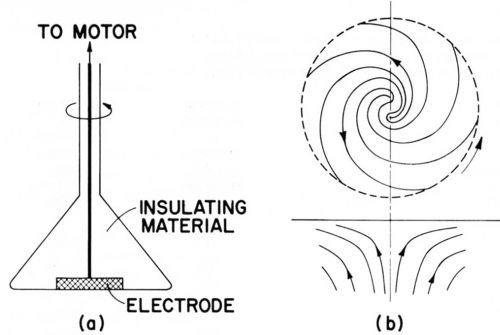
Figure 11A - Rotating disc electrode; (a) cross section, (b) side and bottom view of liquid flow pattern, from Bockris and Drazic.33
Levich developed the equation:
(27)
where j is the mass transport rate in moles/cm2-sec, D the diffusion coefficient, υ the kinematic viscosity, ω the angular velocity (2π rps), CB and CE as before the concentrations in the bulk of the solution and in vicinity of the electrode, just outside the electric double layer. Gregory and Riddiford90,97 provided a minor improvement of Levich's factor 0.62.
Under mass transport control, when CE << CB, Eq. (27) becomes
(28)
By combination of Eqs. (15) and (28), or (14) and (27), one obtains:
(29)
These equations for laminar (non-turbulent) flow apply up to Reynolds numbers NRE of 104 to 105, where NRE = r2ω/υ and r is the disk radius in cm (See e.g., 52, p. 91).
Because of the exact and simple reproducibility of jL or δN the rotating disk electrode is a very valuable tool for the study of transport control of polarization, inhibition, cathodic (or anodic) consumption rates of additives, differential capacities of the electric double layer, etc.

Figure 12 - Current density vs. rotation rate of disk electrode in Watts nickel bath containing 0.15 g/L coumarin at three constant cathode potentials (-700, -725, -750 mV vs. standard hydrogen electrode); from Kruglikov, et al.98
Kruglikov and his co-workers at the Mendeleyev Institute for Chemical Technology in Moscow measured cathodic polarization on the rotating disk electrode in a Watts nickel bath (50°C, pH = 4.5) containing 0.15 g/L coumarin.98 Figure 12 shows the decrease of cathodic current density with increasing rpm at three electrode potentials, which confirms the theory that leveling is due to diffusion-controlled inhibition.
They showed again99 that the inhibiting action of nickel levelers such as coumarin, quinaldine, quinoline, chloral hydrate and thiourea, increases with increasing rotation rate of the disk electrode, and also with decreasing current density. The latter is due to the increase of surface coverage with decreasing i under transport control, as seen from Eq. (26).
Under the same conditions but in absence of coumarin, or in presence of the non-leveler p-toluenesulfonamide,100 the polarization curves do not depend on the rotation rate and the rather slight inhibiting action of the sulfonamide scarcely varies with current density as evidenced by a parallel shift of the E vs. log i lines.100
Under strict transport control, that is, when CE << CB, Eq. (28) shows that equal products CB and evidently also equal CB
, give equal transport rates of the leveler to the cathode and should thus produce identical polarization curves. Kruglikov and co-workers101 showed this to be true in a Watts nickel bath (30°C, pH = 4.5) containing coumarin, namely 0.1 g/L at 360 rpm, 0.063 g/L at 900 rpm, 0.048 g/L at 1600 rpm. They also found identical polarization curves for equal CB
with thiourea in a nickel bath, but not in an acid copper bath. In the latter, apparently only partial diffusion control of the inhibiting action of thiourea is present.
Because of the equal effects of equal CB under transport control Kruglikov, et al.99,101 were able to plot leveling percentage against jL, or, as D and υ did not change, actually against C , and to obtain a smooth curve exhibiting a maximum.
The change of current density (preferably of the effective current density) between two rotation rates of the disk electrode at a selected electrode potential characterizes the leveling properties of an electrolyte. In this potentiostatic method, the cathode potential measurement includes the ohmic potential drop between Luggin capillary and rotating disk electrode which increases with increasing current density. To avoid this error, or its somewhat elaborate correction, Kruglikov and co-workers preferred to apply a galvanostatic method and use the potential difference ΔE = E360 - E4000, that is, between 360 and 4000 rpm, for the prediction of leveling102,103 of many organic compounds. The more negative E4000 is as compared to E360 and consequently the greater ΔE, the greater is the expected leveling. The degree of leveling predicted by ΔE (at three values each of CB and i) agreed essentially with the available knowledge of levelers, the known role of substituents, of hydrogenation, etc. ΔE may also be used for the determination of the concentration of a leveling agent such as coumarin.101
Rogers and Taylor's important studies performed with the help of the rotating disk electrode73,74,105,106 will be discussed in Section 9, as they concern cathodic consumption rates of levelers as well as the inhibition produced by them. Here we mention only that they proved that increasing concentrations of coumarin or butynediol strongly reduce at constant electrode potential the effective or partial current density of nickel deposition, iNi, and not only the total cathodic current density. They also obtained a smooth plot of iNi against the rate of coumarin consumption, which over a wide range of CB was strictly transport controlled and followed the Levich Eq. (28) for jL.
Encouraged by these interesting results, I had made polarization measurements on the rotating disk electrode several years ago and, more recently, my associate Ron J. Lash performed some in the acid copper bath.
We selected as the reference state a cathodic current density of 5 A/dm2 and a rotation rate of 3600 rpm. This reference state may represent a micropeak, or the flat surface separating two microgrooves, at strong agitation. At the cathode potentials required to give 5 A/dm2 at 3600 rpm under various conditions we then reduced the rotation rate and measured the steady state current density obtained. This method is similar to the partly galvanostatic - partly potentiostatic method used by Raub and Stalzer93 with a once static, once rotating cylindrical cathode. One difference is that we used the highest agitation rate for the reference points. Table 2 and Fig. 13 show the results obtained.
Table 2 - Cathode potentials required to give 5 A/dm2 at 3600 rpm in acid copper bath (220 g/L CuSO4•5H2O, 60 g/L H2SO4 without and with additives and influence of decreasing on current density obtained at these potentials.
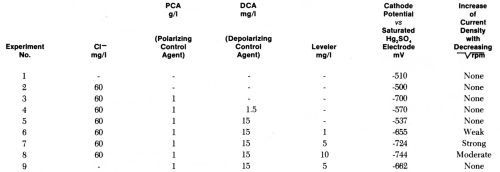
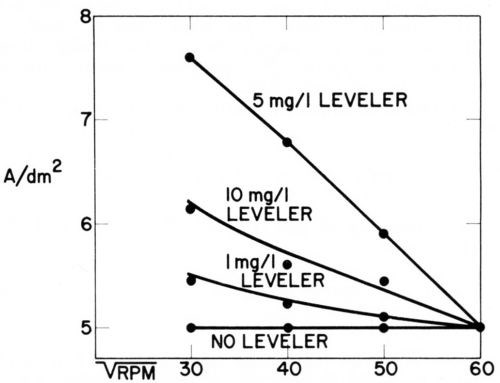
Figure 13 - Current density vs. rotation rate of disk electrode in acid copper bath containing 60 mg/L CI-, 1 g/L polarizing control agent (PCA), 0.015 g/L depolarizing control agent (DCA), and various concentrations of leveling agent. For each bath composition cathode potential gives 5 A/dm2 at 3600 rpm (Lash and Kardos).
In the copper bath (220 g/L CuSO4•5H2O, 60 g/L H2SO4) without or with 60 mg/L Cl-, on addition of 1 g/L of a polarizing control agent, PCA, and on further addition of 1.5 to 15 mg/L of a depolarizing control agent, DCA, the decrease of rpm from 3600 to 900 (or of from 60 to 30) had no influence on the current density obtained at the various potentials. In absence of leveler, the copper deposition rate was not diffusion controlled, although the addition of PCA made the cathode potential more negative by 200 mV and the further addition of DCA depolarized it by 130 mV (at 1.5 mg/L) to 163 mV (at 15 mg/L), giving in the last case an electrode potential only 27 mV more negative than in absence of additives. Although the net polarization produced by PCA plus DCA is so small, their combined effect on brightness and cooperation with the leveler is very great.
On addition of the leveler, cathode polarization is considerably increased, that is, the cathode potential becomes more negative by 118 mV (with 1 mg/L) to 207 mV (with 10 mg/L), and now the current density increases with decreasing and is obviously determined by the diffusion controlled inhibition produced by the leveler. The leveler concentration giving maximum leveling predicted from Fig. 13 would be around 5 mg/L, which seems somewhat high judging from our experience with leveling on surfaces of initial AA roughness of 0.25- 0.5 μm.
Very surprisingly, omission of the 60 mg/L chloride ion causes a loss of all diffusion control and of about 62 mV polarization (compare experiments 9 and 7). We do not yet have a full explanation of this strange phenomenon, but know that in absence of chloride no substantial leveling is produced on scratched panels and brightness is strongly reduced. Compare, e.g., Ref. 179.
As diffusion controlled inhibition is absent in experiments 1 to 5 and 9 one would expect no true leveling under these conditions. Indeed, none occurs under the condition of experiments 1, 2, 3 and 9, but, as we shall discuss in more detail in Section 13, a fair amount of leveling is obtained under the conditions of experiment No. 4 (and after a predip or preplate in solution No. 5 even in solution No. 3) by a completely new leveling mechanism discovered by Dr. J. Schulz-Harder.107
It should be mentioned that in our experiments no correction was made for the ohmic potential drop between disk and Luggin capillary. As this ohmic error increases with increasing current density, the corrected curves corresponding to experiments 6, 8, and especially 7 should show a stronger increase of current density with decreasing than they show in Fig. 13.
9. Cathodic consumption and codeposition rates of leveling agents
While we were preparing our two papers on "Current Distribution on Microprofiles,"1,2 we were not quite satisfied with the only semi-quantitative prediction of leveling from polarization measurements made with and without agitation. We looked for a more quantitative proof of the diffusion theory of leveling and hoped to find it in the cathodic consumption rates of leveling agents. As pointed out in Section 6 the cathodic consumption of levelers should, under strict transport control, occur at its limiting rate, jL = DCBδN (Eq. 15), as CE should be much smaller than CB. Then the variation of δN over the microprofile would have its maximum effect on the local supply rate of leveling agent, the resulting surface coverage by the leveler and the local inhibition of metal deposition, because an increase of δN could not be compensated by a corresponding increase of (CB - CE).
We used butynediol because its concentration is easily determined by bromine addition to the triple bond in presence of a catalyst and back-titration of the excess bromine. To our satisfaction its cathodic consumption rate showed all the signs of diffusion control: it was proportional to CB, increased only moderately with increasing current density, decreased to one-half when mechanical agitation was omitted, and gave reasonable values of D/δN.
Later experiments, reported in Ref. 7, p. 182, gave in a Watts nickel bath (60°C, pH = 4.0, 6.6 A/dm2, air agitation) at a concentration of 2 mM the following j/CB values: 3.0 × 10⁻³ cm/sec for butynediol, 2.9 × 10⁻³ for butenediol, 2.3 × 10⁻³ for coumarin, but only 0.05 × 10⁻³ for the non-leveling control agents benzenesulfonic acid and m-benzenedisulfonic acid and 0.09 × 10⁻³ for saccharin. In consideration of the larger molecular weight of coumarin (146, vs 86 and 88 for butyne-and butenediol), and its consequently smaller diffusion coefficient D, the first three values indicate consumption at the limiting transport rate and consequently strict diffusion control, and the much smaller j/CB values for the non-leveling control agents indicate absence of diffusion control.
Edward's radioactive tracer studies show that the codeposition rates of sulfur from saccharin or p-toluene-sulfonamide,62-65 and apparently also their total cathodic consumption rates, are diffusion controlled only up to about 0.1 mM, which is much below the concentrations used in industrial plating processes. Even in the concentration range where the codeposition of sulfur is diffusion controlled they do not act as levelers because they are too weak inhibitors or even slight stimulators.3,91,100,103,104
A practical consequence of the great difference of the relative cathodic consumption rates j/CB for leveling and non-leveling additives at the concentrations used in industrial processes is the necessity of formulating different makeup and maintenance mixtures of additives.
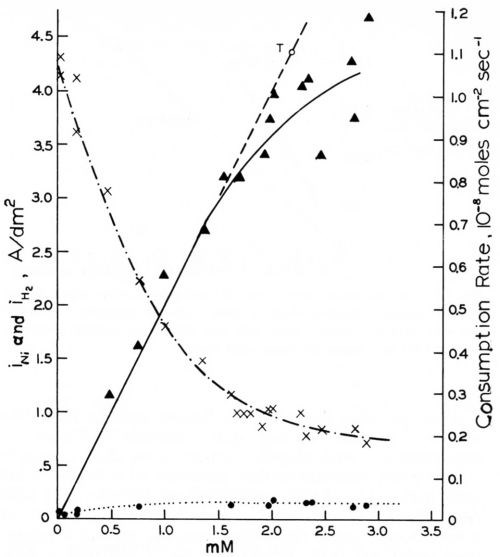
Figure 14 - Rates of cathodic coumarin consumption, nickel deposition and hydrogen evolution vs. coumarin concentration on rotating disk electrode (-960 mVSCE, 980 rpm); from Rogers and Taylor.74
The rotating disk electrode is, of course, a very valuable tool for the study of transport control of addition agent consumption. We shall first report the results obtained by Rogers and Taylor.73,74,105,106 The ascending curve in Fig. 14,74 shows that the consumption rate of coumarin from a Watts nickel bath (48.5°C, pH = 4.0) at a rotating disk cathode (980 rpm) and at an electrode potential of - 960 mVSCE is exactly proportional to the coumarin concentration and follows exactly the Levich equation for iL (Eq. 28), but with the slightly improved coefficient proposed by Gregory and Riddiford,96,97 up to a certain critical concentration of about 1.5 mM or to a critical consumption rate of about 0.7 × 10⁻⁸ mol/cm2-sec. Point T (and the line going through it and the origin) were calculated from the slightly modified Levich equation using the experimental values of D = 7.85 × 10⁻⁶ cm2-sec-1 and υ = 1.12 × 10⁻² cm2-sec-1, both obtained at 48.5°C.
The critical coumarin concentration for the disappearance of strict diffusion control decreases with increasing rpm, decreasing (less negative) cathode polarization and consequently decreasing current density, and with increasing pH. This agrees with Eq. 26, as on the rotating disk electrode kT is proportional to and kred decreases with increasing pH.
The two other curves in Fig. 14 show how the effective current density of nickel deposition, iNi, strongly decreases, and how the much lower current density for hydrogen evolution, iH2, increases, with increasing coumarin concentration.
Butynediol gives cathodic consumption rates and iNi curves105 which are very similar to those shown in Fig. 14 for coumarin. At pH = 4.0, a cathode potential of -960 mVSCE, and 48.5°C, the cathodic consumption rates are proportional to CB up to a consumption rate of 3 × 10⁻⁸ mol/cm2-sec, or more than four times higher than for coumarin. The slope of the j vs. CB line was only slightly greater than for coumarin, which, in consideration of the smaller molecular weight and consequently greater diffusion coefficient of the butynediol, gives again very good agreement with the Levich equation for jL (Eq. 28). At -1100 mVSCE no deviation from strict diffusion control occurred even at a consumption rate of 8 × 10⁻⁸ mol/cm2-sec.
The possible relation of the disappearance of strict diffusion control of leveler consumption rates to the occurrence of leveling maxima was discussed in Section 7. Here we shall show it from Rogers and Taylor's data obtained on the rotating disk electrode.73 Figure 15 superimposes and slightly extrapolates the coumarin consumption rate curves they obtained in a Watts nickel bath (pH = 4,0, 48.5°C, - 960 mV) at 485 rpm and 2250 rpm. The lower rpm may represent the agitation rate at a microrecess point, the higher rpm the one on a micropeak point. δNr/δNp would then be = 2.15. From a critical coumarin concentration upwards jp/jr and presumably θp/θr decreases until at still higher concentration jp = jr and θp = θr. We would expect that at or near the first critical concentration (about 0.75 mM) the maximum of leveling is reached; and that at the second critical concentration (about 4 mM) true leveling should completely disappear. This method would predict the leveling maximum and the disappearance of leveling for a selected cathode potential. Indeed in Fig. 14 above the critical concentration of 1.5 mM (at 980 rpm and -960 mV) both the coumarin consumption curve and especially the iNi curve become increasingly flatter, and from the critical consumption rate of 0.7 × 10⁻⁸ mol/cm2-sec (at -960 mV) upwards the iNi curve vs. total consumption quickly flattens.73
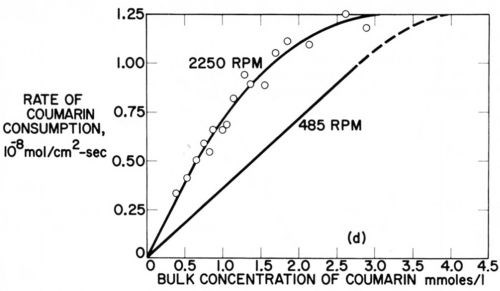
Figure 15 - Cathodic consumption rate of coumarin during nickel deposition vs. coumarin concentration at same cathode potential (-960 mV) but with different rotation rates (485 and 2250 rpm) of disk electrode; plotted from two figures of Rogers and Taylor.73
But would not polarization, inhibition, leveling and leveling maxima better relate to codeposition rates than to total cathodic consumption rates? This is quite possible. Chemical analysis of codeposited carbon and radiotracer studies with C-14 containing nickel levelers show that only a small percentage, of the order of about 1%, or more generally about 0.3 to about 6%, of the cathodically consumed coumarin,8,73,74 butynediol,8,108,109 N-methylquinolinium iodide110 is co-deposited (or "incorporated"). The remainder is reduced, or more specifically hydrogenated, to less adsorbable compounds66,68,105,106,109 and released back into the electrolyte. Compare the important papers on addition agents, especially for nickel plating, by DuRose,41 Saubestre112 and Brown.113-115
It is true that the, let us say, 3% of leveler to be codeposited contribute to surface coverage and inhibition until they are covered by several atomic layers, or one multiatomic layer, of nickel and that the 97% of leveler to be hydrogenated and released into the electrolyte will stay adsorbed only a shorter time, will have a shorter "lifetime" or "stay time" as adsorbed molecules, but we do not know how much shorter. It would be extremely surprising if 94 to 99% or more of a leveler used in nickel plating would be "wasted," that is, would not perform a useful function in surface coverage, brightening and leveling. It is much more probable that they perform this useful function, but by not being incorporated do not impair the physical properties of the nickel deposits.
The radiotracer or chemical studies of addition agent incorporation by Edwards,60-64 Edwards and Levett,65-69 Beacom and Riley,116-119 Doty and Riley,120 Vyagis and co-workers,108 and Matulis109 are very important for the understanding of the action and cooperation (synergism) of addition agents. Some of these studies report a similar trend of the codeposition curves and the polarization curves, e.g., against concentration of coumarin, Ref. 64, Fig. 17, or butynediol,108,109 but not, for instance, for codeposition of N-allylquinaldinium bromide and polarization in dependence on the sodium allylsulfonate concentration above 0.5 g/L, Ref. 120, Fig. 4.
Detailed discussion of these interesting studies is beyond the scope of this paper. To my knowledge they do not supply data on codeposition rates or percentages, which would be directly useful for the prediction of leveling and leveling maxima such as Fig. 14 does for consumption rates at constant potential and constant agitation against concentration, or Fig. 15 does for two agitation rates, or as a plot of consumption rates at constant potential against CB would do.
Such data, and similar data on surface coverage, would show whether total cathodic consumption rates or incorporation rates or surface coverage give the best correlation to leveling. The one study of surface coverage100 which is directly relevant to this subject will be discussed in Section 10.
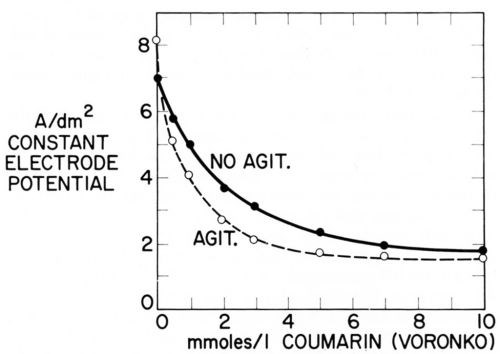
Figure 16 - Current density of nickel deposition vs. coumarin concentration in Watts nickel bath (50°C, pH = 4.0) at same cathode potential (-890 mVSCE) without and with agitation; from Voronko.91
Just as Fig. 15 plots two consumption vs. concentration curves at two different agitation rates, one could plot two iNi vs. concentration curves at two different agitation rates. Voronko91 has done something similar by plotting itotal at constant potential without and with agitation against coumarin concentration. Figure 16 shows that at first addition of coumarin inhibits nickel deposition more with agitation than without. This is expected from Eqs. 15 and 26 because of the smaller δN, or larger kT, in presence of agitation. But the critical surface coverage for the disappearance of strict transport control is first reached in presence of agitation and from then on an increase of coumarin concentration produces a smaller decrease of current density with agitation than without until finally, at about 10 mM = 1.46 g/L coumarin, both curves practically coincide and leveling should disappear. At the concentration where the difference (inon-agit - iagit) or the ratio inon-agit/iagit reaches a maximum (at about 3mM = 0.45 g/L) also the rate of leveling should have its maximum. The maximum ratio could be directly observed if i were plotted on a logarithmic scale because log (ir/ip) = log ir - log ip.
Of course, the leveling maxima predicted from Figs. 14-16 would apply to a selected electrode potential. For practical purposes, one is more interested in leveling maxima at a selected current density. Unfortunately, purely galvanostatic methods are not directly applicable because it is the electrode potential and not the current density which is constant over a microprofile. Consequently one would have to use a partly galvanostatic-partly potentiostatic method, comparable to the one used by Raub and Stalzer93 and by Lash and myself for obtaining Fig. 13.
Before concluding this section we have to summarize the many interesting studies on cathodic consumption and incorporation rates of thiourea, H2NCSNH2. See the survey by Ibl.48
In a Watts nickel bath the incorporation rates of sulfur (but not of carbon) are equal to the cathodic consumption rates70 and both show all the characteristics of diffusion control over a very wide range of conditions.48,60,70,121,122 They are proportional to the thiourea concentration, rather independent of current density (and correspondingly the sulfur content of the deposits strongly decreases with increasing current density), and on the rotating disk electrode proportional to .48,121,122
The incorporation rate of carbon is much lower: the atomic ratio C/S in the nickel deposit varies between 0.015 and 0.05 at 55°C and pH = 460 and 0.1 and 0.4 at 20°C and pH = 2.5.70 Brightness, cathode polarization and leveling show similar trends with increasing thiourea concentration as does the C/S incorporation ratio.70,123 The depolarizing (or stimulating) action of thiourea in the lower concentration or current density range3,60 is apparently related to the depolarizing effect of H2S or NiS.60 Compare also Ref. 124.
In the acid copper bath cathodic consumption rates of thiourea125 and incorporation rates of sulfur126 show also strong features of diffusion control above 2 to 3 A/dm2, but strongly decrease with decreasing current density below this critical current density. In contrast to the nickel bath the cathodic consumption rates in the acid copper bath are about 3 to 4 times larger than the incorporation rates of sulfur.125 The atomic C/S ratios are higher than in the nickel bath and often close to 1.127,127A
Related Content
How to Choose Between Sulfate and Chloride-Based Trivalent Chromium
There are several factors to consider when choosing between sulfate and chloride-based baths for trivalent chromium plating. Mark Schario of Columbia Chemical discusses the differences and what platers should keep in mind when evaluating options.
Read MoreAdvantages to Pumped Eductor Agitation
Not all agitation methods are created equally. Pumped agitation with eductor nozzles can improve process tanks and quickly show a reduction in operating costs while keeping staff safe, following environmental legislation and preventing pollution.
Read MoreSuccessful South African Plater Beating the Odds
Remaining focused on quality and reliability, Team Plating Works stays profitable in a volatile and challenging economy.
Read MorePossibilities From Electroplating 3D Printed Plastic Parts
Adding layers of nickel or copper to 3D printed polymer can impart desired properties such as electrical conductivity, EMI shielding, abrasion resistance and improved strength — approaching and even exceeding 3D printed metal, according to RePliForm.
Read MoreRead Next
A ‘Clean’ Agenda Offers Unique Presentations in Chicago
The 2024 Parts Cleaning Conference, co-located with the International Manufacturing Technology Show, includes presentations by several speakers who are new to the conference and topics that have not been covered in past editions of this event.
Read MoreEpisode 45: An Interview with Chandler Mancuso, MacDermid Envio Solutions
Chandler Mancuso, technical director with MacDermid Envio discusses updating your wastewater treatment system and implementing materials recycling solutions to increase efficiencies, control costs and reduce environmental impact.
Read MoreDelivering Increased Benefits to Greenhouse Films
Baystar's Borstar technology is helping customers deliver better, more reliable production methods to greenhouse agriculture.
Read More




.jpg;maxWidth=300;quality=90)


