Passing Customer Specs for High Phosphorus Electroless Nickel Deposits
Coventya’s Brad Durkin explains how to provide greater than 10.5 percent phosphorus in an EN deposit.
Q: Monthly samples of our high-phosphorus electroless nickel (HPEN) deposit pass more than 200 hours of exposure to neutral salt spray testing (NSST) per ASTM B117, but we are failing our customer specification requirement of providing greater than 10.5 percent phosphorus in the deposit. How is this possible?
A: Various sources of documentation, including those by Ron Duncan, have validated that HPEN structure is a very important performance characteristic of these alloys. Their resulting layers in a deposit may be amorphous, crystaline or a mixture of both, based on the phosphorus concentration in the deposit. When the phosphorus alloy content exceeds 10.5 percent, the EN deposit structure favors an amorphous characteristic—one without any distinct crystal structure—which also represents the least porosity of these deposits. This deposit’s amorphous nature corresponds to high corrosion protection performance, and it is a likely reason why you are easily passing the neutral salt spray test. Porosity failures are common for EN deposits with given degrees of crystalline characteristics or those typically demonstrating less than 10.5 percent phosphorus.
For applicators who are having difficulty meeting the minimum 10.5 percent phosphorus (P) concentration in their HPEN deposits, there are two primary areas of consideration: the methodology of phosphorus analysis and how the phosphorus analysis samples are prepared by the applicator.
Phosphorus Analysis Method
Over the course of many decades, there have been studies of phosphorus analysis methodologies for HPEN2, both destructive and, more recently, non-destructive. I have been involved in a lot of lab work, discussion and round robins on phosphorus determinations in HPEN deposits over the last 34 years, and there are some differing perspectives and interesting twists.
The most representative determinations of phosphorus involve destructive methods, creating a nickel-phosphorus (Ni-P) foil and dissolving a given weight of the foil to determine the concentration of nickel and phosphorus in the alloy. ASTM B733-15 (and prior versions) reference method ASTM E-60, a Standard Practice for Analysis of Metals, Ores, and Related Materials by Spectrophotometry, with references to standard test methods ASTM E352 or E156 (which was withdrawn 1993). The problem here is that these are not specific to ENP deposits. ASTM E352 covers analysis methods for phosphorus in tool steels, and at much lower concentrations than the range for HPEN, while the withdrawn ASTM E156 was for phosphorus determination in brazing alloys, so it’s best to avoid these for ENP deposits. Other destructive dissolution options listed for composition include utilizing atomic absorption methods or inductively coupled plasma (ICP) emission methods. ASTM B733 references using non-destructive X-ray fluorescence spectrometry, but there are few details to help applicators navigate this method, contributing to confusion.
Fortunately, ISO 4527 Annex D does offer some insight and sufficient detail to guide applicators through two destructive methods with dissolution of Ni-P foils. These include methods by either emission or absorption spectra produced by ICP, or a molecular absorption spectrometric method known as the phospho-molybdate-vanadate method. The latter has been a standard for decades.
Both dissolution approaches in ISO 4527 provide very accurate “average” phosphorus analysis results for any HPEN deposit. Why “average?” Dissolving several grams of a Ni-P alloy deposit actually gives an average value and mitigates phosphorus variations resulting from operating conditions, including HPEN pH shifts, solution loading and solution agitation during processing of parts or test coupons. This is not well-known in use of non-destructive methods. These operating conditions do affect the resulting phosphorus analysis data, and this presents today’s applicators with some concerns for meeting a minimum phosphorus requirement.
Today’s non-destructive approaches utilize either X-ray fluorescence (XRF) spectroscopy or energy-dispersive X-ray (EDX) spectrometry techniques. These non-destructive methods make use of the emissions of P-K radiation or excited electrons, or charged particles that can be quantified, and provide a direct phosphorus analysis result. However, in all of these approaches, there are some important considerations regarding procedure setup and technique that turn out to be critical for reproducibility of results. Limitations with these approaches include the capability to anallyze only about 1 to 2 microns of surface depth penetration, which might not be representative of actual alloy consistency due to applicator operating conditions when creating phosphorus standards.
Preparation of Samples for Phosphorus Analysis
Figures 1 and 2 illustrates a typical 12.7-micron (0.0005-inch) deposit that has been analyzed using a validated, non-destructive method of analysis.
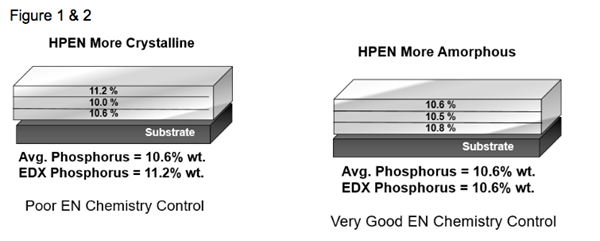
As shown, gradient bands of phosphorus concentrations exist in the alloy as a result of operating conditions including tank solution loading, the amount of solution agitation impinging over the surfaces of parts and, most importantly, the chemistry replenishment additions that are made during the plating cycle. Very good chemistry control and plating methodology will provide phosphorous uniformity throughout the layers, and percentages greater than 10.5 percent will ensure a higher amorphous characteristic. As demonstrated in Figure 1, a high result for the percentage P on the surface does not guarantee low porosity in the deposit. Once any given amount of crystalinity develops anywhere throughout the layer, a pore is created, and that provides a potential avenue for deposit failure in NSST.
For HPEN systems:
- Solution loading has significant impact on phosphorus co-deposition; increasing the loading increases the percent P alloy.
- Loading at or below 0.1 ft.2/gallon can potentially lead to percent P alloy concentrations below the 10.5 percent threshold.
- Higher solution agitation and increased part-to-solution interaction decreases the percent phosphorus alloy.
- Low solution agitation overall provides higher phosphorus across all ranges of loading.
Data in Table 1 also support that low solution loading has a tendency to produce lower-than-required phosphorus results and can vary by as much as 1 percent phosphorus just being dependent on solution loading.
|
TABLE 1 |
||||
|---|---|---|---|---|
|
Formulation HPEN |
0.8 |
0.4 |
0.07 |
Comments |
|
HPEN Type 1 – |
11.5 |
11.0 |
10.5 |
Low loading, too low phos |
|
HPEN Type 2 – |
10.9 |
10.7 |
10.1 |
Low loading, fails phos; high crystalinity |
|
HPEN Type 3 – |
12.0 |
11.5 |
10.5 |
Low loading, too low Phos |
|
HPEN Type 3 – |
11.3 |
10.5 |
10.2 |
Poor EN control; low loading, fails phos ; high crystalinity |
Applicators who plate only a few phosphorus analysis test coupons in a large-volume HPEN solution with no additional workload risk analysis failure due to poor solution loading ratios. Experience additionally shows that XRF or EDX methods can provide variance in phosphorus analysis results of as much as 0.3 percent w/w phosphorus in a given determination, even with proper techniques. Even ISO 4527 stipulates that the mass fraction of phosphorus should be within +/- 0.5 percent w/w.
If the applicator HPEN system is operating near the 10.5 percent +/- 0.3 w/w P threshold, realistically the phosphorus could be 10.2 to 10.8 percent, but since NSST is good, it’s more likely the phosphorus is greater than 10.5 percent, providing a more amorphous, non-porous deposit. Often, a nitric acid immersion test (50 percent v/v nitric acid at 75ºF for 30 seconds immersion) on the failed test coupon can further validate if phosphorus is below 10.5 percent, which will exhibit darkening of the deposit. A non-dark deposit represents a greater than 10.5 percent alloy.
Brad Durkin is director of international product development for Coventya. Contact Brad at b.durkin@coventya.com for more specific details about HPEN Ni-P analysis considerations.
References
- The Metallurgical Structure of EN Deposits – Its Effect on Coatings Properties by Ron Duncan, published in the Electroless Nickel Conference 1993 proceedings.
- Direct Determination of Phosphorus Content in EN Plating Using X-ray Fluorescence (XRF) Spectroscopy by Michael Haller, published in the IPC Apex Expo Conference proceedings.
Related Content
Advantages to Pumped Eductor Agitation
Not all agitation methods are created equally. Pumped agitation with eductor nozzles can improve process tanks and quickly show a reduction in operating costs while keeping staff safe, following environmental legislation and preventing pollution.
Read MoreHow to Choose Between Sulfate and Chloride-Based Trivalent Chromium
There are several factors to consider when choosing between sulfate and chloride-based baths for trivalent chromium plating. Mark Schario of Columbia Chemical discusses the differences and what platers should keep in mind when evaluating options.
Read MoreInnovation in Plating on Plastic
Plating on advanced plastics solution offers improved adhesion, temperature resistance and cost savings.
Read MoreA Chromium Plating Overview
An overview of decorative and hard chromium electroplating processes.
Read MoreRead Next
Delivering Increased Benefits to Greenhouse Films
Baystar's Borstar technology is helping customers deliver better, more reliable production methods to greenhouse agriculture.
Read MoreA ‘Clean’ Agenda Offers Unique Presentations in Chicago
The 2024 Parts Cleaning Conference, co-located with the International Manufacturing Technology Show, includes presentations by several speakers who are new to the conference and topics that have not been covered in past editions of this event.
Read MoreEducation Bringing Cleaning to Machining
Debuting new speakers and cleaning technology content during this half-day workshop co-located with IMTS 2024.
Read More








.jpg;maxWidth=300;quality=90)


