Current Distribution on Microprofiles - The 14th William Blum Lecture - Part 1
This article is the first of four parts of a re-publication of the 14th William Blum Lecture, presented at the 60th AES Annual Convention in Cleveland, on June 18, 1973. Dr. Otto Kardos gives a comprehensive discussion of how the deposit forms on surface textures, and how leveling and brightness are achieved.
by
Otto Kardos
M&T Chemicals
Ferndale, Michigan
Recipient of the 1972 William Blum
AES Scientific Achievement Award
Editor’s Note: Originally published as Plating, 61 (2), 129-138 (1974), this article is the first of four parts of a re-publication of the 14th William Blum Lecture, presented at the 60th AES Annual Convention in Cleveland, on June 18, 1973.
A printable PDF version of Part 1 is available by clicking HERE.
The printable PDF version of the complete 52-page paper is available HERE
ABSTRACT
A survey of experimental facts and theory is given. The three types of cathodic metal distribution on microprofiles (recess/peak thickness ratio = 1, < 1, > 1) are explained. Diffusion controlled inhibition is shown to be the preponderant mechanism of the last type. Cathodic and anodic microthrowing power are compared. Roughness formation on initially smooth surfaces, and its prevention by addition agents or by modulated current, are discussed and possible brightening and leveling mechanisms other than diffusion controlled inhibition are suggested.
1. Introduction
Current distribution on microprofiles was also the subject of two papers written by Dr. Foulke and myself for the 1956 Convention of the American Electroplaters' Society. These papers supplied proofs for a diffusion theory of leveling and "bad microthrow."1,2 At about the same time, Watson and Edwards3 developed independently a very similar diffusion theory of leveling and Leidheiser4 had published the outline of a somewhat different theory.
These papers aroused considerable interest, and many studies on cathodic current and metal distribution on microprofiles, especially on leveling, were made in this and other countries. They generally supplied new or more exact proofs of the diffusion theory of leveling, but some studies reported at the same AES Convention by Thomas,5 supported another theory which ascribed the increased adsorption of the leveling agent on micropeaks not to a greater local diffusion rate but to "shape-sensitive" adsorption related to the small radius of curvature of the micropeaks.
In view of the great practical importance of leveling, of the possible relevance of a correct theory of leveling to the understanding of brightening, and of the considerable international research effort in this field, it seems useful to summarize the theory, report on the significant contributions of others, and to look at where we are now.
For reviews of the field of microthrowing power see references 6-12.
Cathodic metal distribution on microprofiles, which may be defined as profiles which have a roughness depth or height of less than about 0.5 mm (500 μm, 0.02 in.), shows a surprising variety: on descent from a micropeak into a microdepression, the metal deposit thickness may decrease, remain constant, or increase. One speaks correspondingly of "bad microthrow," "good microthrow" and "true leveling" (excellent microthrow).
Good microthrow or the rather uniform metal deposition into small pores, crevices and scratches was first described by W. Meyer13 in 1935. All three types of microthrow were described by Gardam in 194714 and by Reinhard in 1950.15 Well-leveling nickel baths16,17 were available in the late forties.
But in the fall of 1955 when Dr. Foulke and I started to think more intensely about microthrowing power, no general theory was available. As is often the case in electroplating, and in many other technological areas, "art" preceded "science," or empirical technology preceded scientific understanding. However, one type of microthrowing power, namely practically uniform metal distribution ("good microthrow"), was already explained as a benefit from the well-developed theory of macro-throwing power.
2. The theory of macrothrowing power and its contribution to the understanding of microthrowing power
To understand microthrowing power it is necessary to first understand macrothrowing power, that is cathodic current and metal distribution on large-scale profiles, the so-called macroprofiles. The theory of macrothrowing power had been developed much earlier and the classical paper about this theory was published by Haring and Blum 50 years ago.18 Their paper defined "primary" and "secondary" current distribution, pointed out the influence of the variation of current efficiency with current density on metal distribution, and defined throwing power (which meant at that time, of course, macrothrowing power) as "the deviation (in per cent) of the metal distribution ratio from the primary current distribution ratio." Good reviews on macrothrowing power are found in references 9, 18-25.
Primary current distribution is the current distribution which would be obtained in absence of polarization, which increases with increasing local current density. It would be determined only by the resistance which the electrolyte opposes to the flow of electric current to the different electrode areas. Because of the much higher (often a million times) electrical conductivity of metals as compared to the conductivity of electrolytes, the surface of a metallic electrode can generally be considered to be at practically constant potential, unless the electrode is very long or thin. Finding the primary current distribution on a flat or profiled electrode in the presence of a counter-electrode and of the nonconducting boundaries formed by the walls of the plating cell consists thus in finding the potential distribution between two equipotential surfaces. Mathematical20,26,27,27A,29A as well as experimental methods23,28,28A,29,29A are available for the determination of primary current distribution. The latter depends on the shape, the relative sizes and positions of the electrodes and of the nonconducting walls of the electrolytic cell, but it is independent of the absolute size of the system, of the electrolyte properties and the conditions of electrolysis.
In primary current distribution the current concentrates on protruding areas not only because of their smaller distance from the counter electrode but, still more, because of their lateral accessibility to the current. Indeed primary current distribution would give infinite current density on ideally sharp peaks and zero current density on the sharp hollow corners of a triangular wave profile.
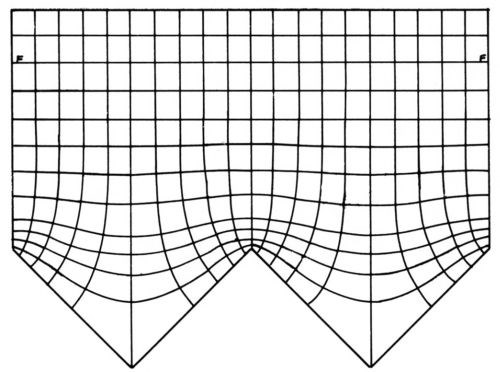
Figure 1 - Primary current distribution, from Rousselot.29
Figure 1 shows an experimental plot29 of equipotential lines and, perpendicular to them, current flow lines at and near a triangular wave electrode. The potential difference between two adjacent equipotential lines is constant and the same current flows to the electrodes between two adjacent current flow lines. The local current density is σ|dϕ/dx| where σ is the specific electric conductivity of the electrolyte and |dϕ/dx| is the absolute value of the potential gradient. The latter is much greater over the protrusions than over the valleys, and the difference increases with smaller notch (or apex) angles.
Any equipotential line may be replaced by an equally shaped counterelectrode, and any current flow line by a nonconducting boundary, without change of the primary current distribution. The equipotential lines become practically flat at the rather short distance of about half the groove width from the micropeaks.27
On a working or "polarized" electrode the "electrode potential" E, which depends on the potential drop in the electric double layer, is different from the equilibrium potential, or - if several reactions occur simultaneously on the electrode - from the rest or zero-current potential. These deviations of E are called overpotential or overvoltage (η = E - Eeq) and polarization (E - Erest), respectively. Their presence changes "primary current distribution" into "secondary current distribution."
For the purpose of this paper it will be sufficient to distinguish activation overpotential (required to reduce the activation energy of the rate determining step, which is often the "charge transfer" in which ions or electrons are transferred through the electric double layer) and concentration overpotential (due to concentration changes in the vicinity of the electrode). Good discussions of overpotential are found in the comprehensive references 30, 31 or the shorter 9, 30A, 32-35 and the very recent 35A.
Polarization increases with increasing current density current distribution on the peaks, or protruding areas, of a profile produce there a much greater polarization than in the recess or valley areas. This greater overpotential on the peaks tends to oppose current flow and to divert current towards the recess areas. The ohmic resistance to be overcome decreases with decreasing profile depth and, thus, the equalizing effect of polarization should be the greater - and secondary current distribution the more uniform - the smaller the profile depth. On very small-scale profiles, current distribution should consequently become practically uniform. This was pointed out by Kasper,19 DuRose, Karash and Willson17 and Wagner.20
Before we discuss this very important extension of the theory of macrothrowing power to microprofiles we have to remember that cathodic metal distribution on macroprofiles is strongly, and often decisively, influenced by the variation of current efficiency with current density. If the current efficiency decreases with increasing current density, as it generally does in cyanide baths, metal distribution is more uniform than secondary current distribution. If current efficiency increases with increasing current density, as is the case over the entire current density range in chromium plating baths and in the low current density range in nickel baths, metal distribution is less uniform than secondary current distribution.
Wagner20 developed an approximate method for calculating to what extent uniform current distribution is approached over a small-scale triangular wave electrode. The following calculation is a slight modification of his procedure (See also ref. 7, pp. 158-159).
The relative electrode potential E may be represented by the equation:
(1)
where ϕMe is the potential of the metallic electrode, ϕs the potential of the solution side of electric double layer, and where the "constant" depends on the reference electrode.
If one assumes tentatively uniform current distribution over the microprofile with equidistant equipotential lines parallel to the "mean" or "geometric" surface (but not to the "true" surface) and equidistant and parallel current flow lines perpendicular to the equipotential lines, then
(2)
where ϕp and ϕr are the potentials on the solution side of the electric double layer at the peaks (crests) of the triangular wave profile and in the recess depths, respectively, where d is the groove depth, σ the specific conductivity of the electrolyte, and i∞ the uniform current density at "infinite" distance from the profile (practically a distance of about half the groove width is sufficient) which for this calculation is assumed to be approximately constant also in close vicinity of the profile. On microprofiles i∞ is also equal to the "apparent" current density.
Combination of Equations (1) and (2) gives
(3)
Increase of Er - Ep means that Er becomes less negative and that consequently the corresponding cathodic current density becomes smaller.
If the angle enclosed by the equal triangle sides is β, then the average current density
(4)
Substitution of Equation (4) into Equation (3) gives
(5)
Equations (3) or (5) show that the electrode potential E is practically uniform over the profile if the profile depth d is sufficiently small. The profile depth has to be the smaller the larger the current density, i∞ or iav, and the smaller the specific electric conductivity, σ.
One may come to the same conclusion by another line of reasoning: Substantial differences of Er and Ep, and correspondingly of ϕr and ϕp, would lead to strong currents along the side walls of the microgrooves if the peak to recess distance is small. The current flowing to a micropeak would thus split into two parts: one passing through the electric double layer at the peak, the other flowing along the side wall not only to the deepest recess point but also to intermediate points on the slope.
If one considers only the highest peak and deepest recess point the current along the side wall would be equal to σ (ϕp - ϕr)/s, where s is the length of the side wall. This lateral current flow increases with decreasing s and tends to equalize current distribution. A more rigorous mathematical treatment of this concept would be useful.
If one wishes to proceed from the potential differences of Equations (3) and (5) to current density differences it is simplest to assume that the same polarization equation applies to all points of the electrode and that it may be linearized at least over a certain current density range;20,21 compare also,19 so that
(6)
and consequently
(7)
From the combination of Equations (5) and (7) one obtains
(8)
where kc, the so-called polarization parameter, equals σ|dE/di|.
If one wishes to obtain a similar equation for the groove width a instead of the groove depth d one obtains, because d = a/[2 tan(β/2)],
(9)
Equations (8) and (9) show that current distribution becomes practically uniform if the profile depth or width is much smaller than the polarization parameter kc.
It should be mentioned that De Levie36,37 proposed a modification of Wagner's method for estimating the uniformity of current distribution on small-scale profiles. As it leads to a more complicated equation the simpler procedure is sufficient for our purpose.
When polarization is predominantly concentration polarization, its slope |dE/di| and consequently kc increases with increasing current density and becomes infinite at the limiting current density. But concentration polarization does not throw the current into a micro-recess,2 as we shall see in Sections 3 and 6.
Only activation polarization throws the current into a microrecess. If the electrode potential is sufficiently negative as compared to the equilibrium potential, so that the anodic partial reaction is much smaller than the cathodic partial reaction, ia << ic, then the cathodic activation overpotential ηact is given by the equation:
(10)
which may also be rearranged to the Tafel form
(11)
or simply
(12)
As η = E - Eeq where Eeq is the equilibrium or reversible potential,
(13)
In the preceding equations R is the gas constant (8.314 joules), T the absolute temperature, F the Faraday constant (96500 coulombs), αc the cathodic transfer coefficient, i0 the exchange current density at the equilibrium potential where the cathodic and anodic partial reactions, ic and ia, are equal, and A and B are the so-called Tafel constants.
Electrodeposition of multivalent metals is generally a sequence of several reaction steps of which one is rate determining. If no electrons are transferred before the rate determining step, then αc = βr, where β is the "symmetry factor" generally equal or close to 0.5, and r is the number of electrons transferred in the rate determining step.30,32 See also Section 6.
Thus, if the first reaction step is rate determining in the reaction sequence
(1) Cu++ + e- = Cu+
(2) Cu+ + e- = Cu
the expected value of αc would be 0.5.
This theoretical value of 0.5 for αc gives a Tafel constant B of 0.118 V at 25°C and 0.132 V at 60°C. The experimental values of B were about 0.104 V for acid copper at 25°C38,39,40,162 and 0.1 to 0.11 V for the Watts nickel bath at 60°C.41,42
With a Tafel constant B equal to 0.1, |dE/di| = 0.1/2.303 i = 0.043/i, or, at, e.g., 0.03A/cm2, |dE/di| = 1.43. With conductivities, σ, for the Watts nickel bath (60°C) of 0.09 ohm-1cm-1,43 for the regular acid copper bath (200 g/L CuSO4•5H2O, 50 g/L H2SO4; 25°C) of 0.18 ohm-1cm-1, and for the high-throw acid copper bath (100 g/L CuSO4•5H2O, 150 g/L H2SO4; 25°C) of 0.5 ohm-1cm-1,44A one obtains kc values (see Eq. 8) for activation polarization at 3 A/dm2 of 0.13 cm, 0.26 cm and 0.72 cm respectively. Note that kc has the dimension of length.20
To obtain a deviation from uniform current distribution of 2% or less and thus (ip - ir)/iav ≤ 0.02, Equation (8) would require d ≤ 0.02 kc sin (β/2). With β = 90° and thus sin (β/2) = 0.7071 and a/2 = d, a deviation from uniformity of only 2% would require a/2 = d ≤ 0.01414 kc.
For the Watts nickel bath this would mean that, at a current density of 3 A/dm2, a/2 and d ≤ 0.0018 cm. For the two acid copper baths a/2 and d would have to be equal or smaller than 0.0036 cm or 0.01 cm, respectively. At the ten times smaller current density of only 0.3 A/dm2 the profile dimensions could, of course, be ten times larger and still the same practically uniform current distribution would be obtained.
The decrease of the thickness ratio hr/hp on micro-profiles with increasing current density in electrolytes containing no additives has been frequently confirmed.1,15,45,138,160 It may be due not only to the decrease of |dE/di| for activation polarization but also to the increasing influence of concentration polarization (See Section 3).
The decrease of hr/hp with increasing current density occurs also in electrolytes containing leveling agents1,45,46,91 except if the leveling agent concentration is higher than the optimum. For more details see Section 7.
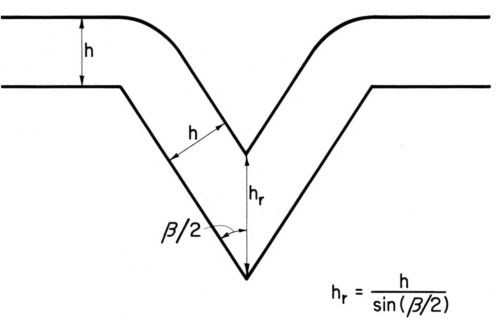
Figure 2 - Geometric leveling at uniform current distribution, from Kardos and Foulke.7
It should be mentioned that even uniform current and metal distribution over a microprofile produces leveling, the so-called "geometric leveling", first described by DuRose, Karash and Willson.17 (See also Ref. 7, pp. 202-203). As can be seen from Fig. 2, a metal deposit of uniform thickness h reduces the groove depth by . This effect is especially great for small enclosed angles β; for instance for β = 30° sin β/2 = 0.259 and thus the reduction of groove depth would be h (3.85 - 1) = 2.85 h. The preceding equation becomes invalid for relatively thick deposits and because of the rounding of groove edges; "geometric leveling" proceeds then at a somewhat lower rate. Its rate diminishes also with increasing current density because at higher current densities, especially with small enclosed angle, the supply rate of the metal ions to the groove depth is limited and thus "bad microthrow" starts in the groove depth.7,9,45
3. The influence of mass transport on microthrowing power
When in the fall of 1955, Dr. Foulke and I were thinking about an explanation of the various types of microthrowing power, one type, namely "good microthrow" or practically uniform current distribution, was thus already understood, but the two other types, "true leveling" and "bad microthrow" were still unexplained. The change of "good microthrow" into "bad microthrow," or more exactly the decrease of the thickness ratios hrecess/ hpeak, with increasing current density1,15,45,138,160 could be partly explained by the increase of Er - Ep and thus Er becoming less negative according to Equations (3) and (5), or by the decrease of the slope |dE/di| of activation polarization according to Eq. (13). But why should not the increasing concentration polarization push the current into the microrecess?
Why should cyanide baths, which in comparison with noncomplexed acid baths give better macrothrowing power, show worse microthrowing power? And how is true leveling with thickness ratios hr/hp often substantially greater than unity explained?
It had been suggested that the complicated phenomena of cathodic metal distribution on microprofiles could only be explainable by a variation of the polarization equation17,19C or of current efficiency19C over the profile, e.g., depending on surface curvature, but no definite mechanisms were proposed and proved.
I still remember the train of thought leading to our approach to this problem. The question: "What is the difference between microthrowing power and macrothrowing power?" did not yield a quick answer. It changed into the questions: "What is the difference between microprofiles and macroprofiles? Are the characteristic dimensions, such as groove depth or width, of microprofiles smaller, and of macroprofiles larger, than a certain critical dimension? Could this critical dimension be the thickness of the diffusion layer?"
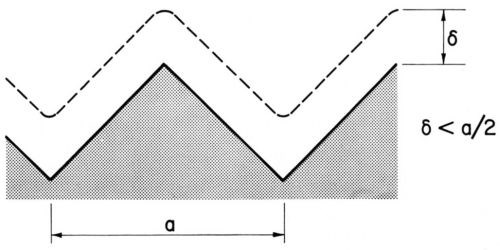
Figure 3(a) - Diffusion layer over a macroprofile, from Ibl.48
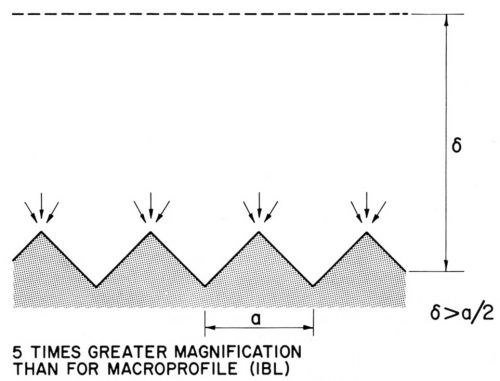
Figure 3(b) - Diffusion layer over a microprofile, from Ibl.48
Brenner47 had obtained by his freezing method a diffusion layer thickness of about 0.4 mm = 400 μm for a non-agitated nickel or acid copper bath and about half this value for an agitated copper bath. These thicknesses were of the right order to separate macroprofiles from microprofiles. On macroprofiles the diffusion layer boundary could follow the contour of the profile, and the diffusion layer thickness would be the same for all profile points, as shown in Fig. 3(a).48 On a microprofile, which is shown in Fig. 3(b) at about five times greater magnification, the diffusion layer boundary cannot follow the shape of the profile but is flattened out at some distance from it. The diffusion layer thickness is consequently greater over recess areas than over peak areas.
Let us recall the meaning of the diffusion layer. If a species, such as metal ions or addition agents, is consumed at the cathode, there will be a layer near the cathode where its concentration is smaller than in the bulk of the solution. The species can be transported to the cathode by ionic migration under the influence of a potential gradient if it carries a positive charge (or away from it if it carries a negative charge), by convection due to a movement of the electrolyte, and by diffusion under the influence of a concentration gradient.
The electric current is transported by all ionic species in the electrolyte. If tMe is the transport number of the depositing metal ion then the ionic migration current is equal to itMe and the remainder, i (l - tMe), has to be supplied by convection and diffusion. In presence of inert electrolyte (e.g., the sulfuric acid in acid copper) tMe is small; if the metal is deposited from an anion, such as a metal cyanide complex or chromic acid, tMe is negative, that is ionic transport carries the metal-bearing anion away from the cathode. Uncharged addition agents have of course no transport number and thus are brought to the cathode only by convection and diffusion.
In laminar (nonturbulent) flow the relative movement of electrolyte and electrode vanishes on approach to the electrode and thus in the inner part of the diffusion layer only diffusion and ionic migration are effective, and in the case of an uncharged addition agent, only diffusion.
In this paper we shall frequently use the simpler terms diffusion, diffusion control, diffusion theory, etc., where convective diffusion (the combination of convection and diffusion), mass transport, or the synonymous mass transfer, and the corresponding word combinations, would be the more exact terms.
The concentration profiles in the diffusion layer may be obtained by a variety of methods, e.g., by Brenner's freezing method47 and by interferometric methods49,50 including laser interferometry.51
The diffusion rate j (in moles/cm2-sec) is given by the equation:
(14)
where D is the diffusion coefficient, frequently of the order of 1 × 10⁻⁵ cm2/sec, but about five times as high for hydroxyl ions and 10 times as high for hydrogen ions (compare e.g., Refs. 52 and 95), |dC/dx|x=0 is the concentration gradient in immediate vicinity of the cathode, CB and CE the bulk concentration and the concentration in immediate vicinity of the electrode, and δN the effective or equivalent or Nernst thickness of the diffusion layer. δN is really a fictitious term; but it, and not δ, the distance between a profile point and the diffusion layer boundary, has to be used for the calculation of diffusion flow.
If CE << CB one obtains the equations for limiting diffusion flow:
(15)
and for limiting current flow
(16)
where n is the valency of the depositing metal and F is Faraday's constant.
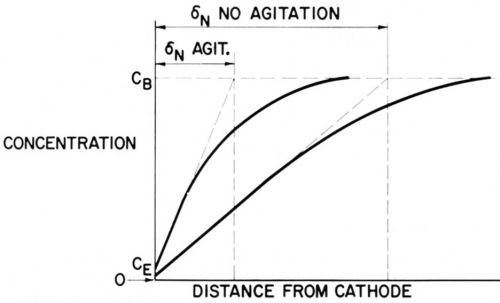
Figure 4 - Concentration profiles in the diffusion layer with and without agitation.
Figure 4 shows two schematic concentration profiles, one without agitation, the other one with a fair rate of agitation. In both cases CE << CB and diffusion approaches its limiting rate.
It is important to remember that each species consumed at the cathode has its own concentration profile.
The variation of the limiting diffusion flow, or of δN, over a microprofile such as the one shown in Fig. 3(b) is really much greater than the variation of δ, the distance between a profile point and the diffusion layer boundary, because the peaks receive diffusion flow also laterally, they divert diffusion flow from the recess areas. Indeed, if convection does not interfere, the limiting diffusion flow, and correspondingly 1/δN, varies over a microprofile as much as the current density in primary current distribution. This is due to the formal similarities of the laws of current flow and diffusion flow, such as i = δ |dE/dx| and j = D |dC/dx|, and was discussed and applied to anodic smoothening by Elmore,53 Edwards54 and Wagner.55 Thus, Fig. 1 may also represent equiconcentration and diffusion flow lines if the boundary of the diffusion layer is sufficiently far away, and the profile small enough, so that convection does not interfere with diffusion between the profile and the flattened equiconcentration line F - F. This analogy was shown by Edwards54 to apply to horizontal, laterally shielded, profiled anodes, facing upwards, which under electropolishing conditions dissolved according to primary current distribution, and to a considerable extent also to unshielded anodes, that is in the presence of convection.
For reviews on mass transport, including diffusion, see Refs. 12, 48, 50, 56-59A.
Now back to 1955! We asked ourselves: Could the variation of the diffusion layer thickness, and especially of the effective diffusion layer thickness δN, over a microprofile, explain "true leveling" as well as its opposite "bad microthrow" and also be compatible with uniform metal distribution or "good microthrow"? How to obtain a quick answer? It was well-known that increased agitation increases the limiting diffusion rate, or correspondingly decreases the effective thickness of the diffusion layer. It should, consequently, be possible to duplicate current distribution on microprofiles by obtaining polarization curves on flat electrodes at two different agitation rates, e.g., at a certain rate of mechanical agitation and in absence of agitation, that is, at "natural" convection, which is due to the electrolyte density differences developing at the electrodes.
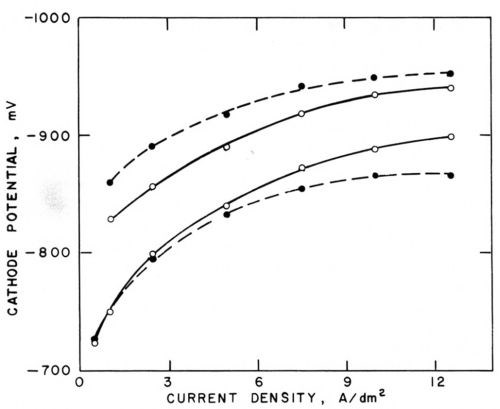
Figure 5 - Polarization curves (versus saturated calomel electrode) in Watts nickel bath (50°C, pH = 3.0) without agitation (○─○) and with agitation (●─●); lower pair with addition agents, upper pair with 0.4 g/L butynediol; from Foulke and Kardos.1,7,10
Figure 5 shows such polarization curves obtained without agitation (solid curve) and with mechanical agitation (broken curve). The cathode potentials were measured against a saturated calomel electrode with the help of a Luggin capillary. The lower pair of curves was obtained in a Watts nickel bath (50°C, pH =3.0) containing no additives, the upper pair in presence of 0.4 g/L butynediol.1 The influence of agitation on the change of current density at a given electrode potential is of three types corresponding to the three types of microthrowing power.
Type I ("Good Microthrow")
In absence of additives and up to about 3 A/dm2, agitation has little influence on polarization. The metal deposition rate is not controlled by the metal ion supply rate to the cathode; the ratio inon-agit/iagit is close to unity and consequently also the current density ratios ir/ip and the deposit thickness ratios hr/hp should be close to unity.
Type II ("Bad Microthrow")
At higher current density, agitation depolarizes by eliminating part of the concentration polarization. Correspondingly, at a given cathode potential, agitation increases the current density, inon-agit/iagit < 1, and, consequently, also ir/ip and hr/hp should be smaller than unity. This type of microthrow would be due to the fact that here the metal deposition rate is controlled, to at least some extent, by the supply rate of the depositing metal ions to the cathode.
Type III ("True Leveling")
In presence of 0.4 g/L of the leveling agent butynediol (upper pair of curves in Fig. 5), polarization is, at a given current density, increased by about 100 mV and, correspondingly, current density is strongly decreased at a given electrode potential. Butynediol is a strong "polarizer," in consideration of the first effect, and a strong "inhibitor," in consideration of the second one. Now agitation increases polarization and inhibition; at a given cathode potential, inon-agit/iagit is greater than unity and, consequently, also ir/ip and hr/hp should be greater than one. This would be a case of "true leveling", which would be due to the fact that here the metal deposition rate is controlled by the transport rate of the inhibitor butynediol to the cathode.
Comparison of the inon-agit/iagit ratios obtained from each pair of polarization curves showed good agreement with the thickness ratios obtained at the same apparent or, in some cases, peak current density on phonograph record masters, on which the groove depth was about 37.5 μm, the enclosed angle β slightly less than 90° and, consequently, the groove width about twice the groove depth, and the mutual distance of the micro grooves about equal to their width. hr was measured halfway down the groove slope or at the bottom of the groove, hp in the middle of the flat area between two microgrooves or at the rim of the groove. If hr is measured at the bottom of the groove, it does not represent a local deposition rate and even a uniform deposition rate would produce some "geometric leveling." (See Fig. 2 and Section 2)
Similar pairs of polarization curves1 correctly predicted the strong leveling obtained with 0.2 g/L cadmium, the leveling obtained with 0.2 g/L thiourea, and the bad microthrow obtained with only 0.02 g/L thiourea, all in the Watts nickel bath (50°C, pH = 3.0, 4.3 A/dm2, mechanical agitation). At 0.02 g/L, thiourea acts as a depolarizer (activator, stimulator) of nickel deposition and its greater supply rate to micropeaks stimulates deposition there more than in the recess areas; consequently bad microthrow results. The complex behavior of thiourea was confirmed by several other studies.3,6,64,70 See also Section 8 and 9.
Agitation increases polarization in a Watts nickel bath (pH = 3.5, 50°C) containing 1 g/L coumarin up to about 8 A/dm2. At higher current densities, where, apparently, diffusion control by the metal ion takes over, agitation depolarizes. In the presence of 15 g/L of 1,3,6-naphthalene trisodium sulfonate, agitation depolarizes over the whole current density range (0.5 to 12.5 A/dm2). If this applies also to the effective current densities of nickel deposition, it would mean hr/hp ratios smaller than one.
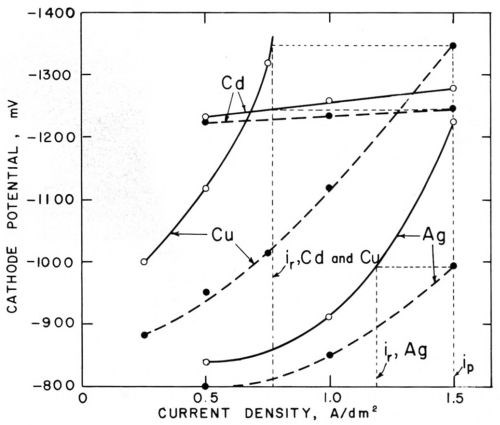
Figure 6 - Polarization curves (versus saturated calomel electrode) in cyanide cadmium, copper and silver baths (25°C) without agitation (○─○) and with agitation (●─●); from Foulke and Kardos.1,7,10
Figure 6 shows similar pairs of polarization curves for cyanide copper, silver and cadmium baths. Agitation strongly decreases the concentration polarization of the cyanide copper and silver bath, which in this case is due not only to a decrease of the concentration of the metal cyanide complex in the vicinity of the cathode but also to a local increase of the concentration of cyanide ions which are freed at the cathode. In the cyanide cadmium bath, agitation depolarizes only slightly, but, nevertheless, inon-agit is considerably smaller than iagit and, for all three baths, ir/ip and hr/hp ratios considerably smaller than unity are predicted and actually measured on the microprofiles. The case of the cyanide cadmium shows that the change of polarization produced by agitation at constant current density is much less relevant for the prediction of microthrow than the change of current density at constant electrode potential. This agrees with the basic concept that the electrode potential is practically constant over a microprofile.
While on macroprofiles concentration polarization as well as activation polarization tends to throw the current into the recess areas, on microprofiles only activation polarization throws the current into the recess, but concentration polarization throws the current out of the microrecess. This helps to explain why cyanide baths give better macrothrow but worse microthrow than noncomplexed acid electrolytes. Furthermore, on macroprofiles, over which the diffusion layer thickness is practically uniform, metal distribution from cyanide baths is improved by the strong decrease of cathodic current efficiency with increasing current density. On microprofiles the variation of current efficiency over the profile should be much smaller because its decrease with increasing current density should be counterbalanced by its increase with decreasing δN (increasing agitation rate).
The successful prediction of cathodic metal distribution on microprofiles from polarization curves obtained with and without agitation strengthens the hypothesis that it is the variation of diffusion layer thickness over a microprofile that causes the two opposite cases of bad microthrow and true leveling.
We knew of course, and expressed this knowledge in our papers,1,2 that no exact correspondence of the inon-agit/iagit ratios and the thickness ratios could be expected for a variety of reasons.
The polarization curve obtained with agitation could be made to correspond to the polarization curve on the flat area midway between two microgrooves; but to what point inside the groove would the polarization curve apply which was obtained without agitation?
Another source of error is the ohmic potential drop between Luggin capillary and cathode; this ohmic error increases with increasing current density and, if one corrects for it, the higher current density curve would be displaced towards still higher current density. Thus, the actual nonuniformity of deposit thickness should be greater than the one predicted from the polarization curves.
Another significant source of error is the use of total current densities instead of the partial or effective current densities of metal deposition in our polarization curves. Even in the absence of additives agitation decreases the current efficiency of nickel deposition, especially in the low current density range, because of the increased supply rate of hydrogen ions.71 Thus over a certain current density range the two polarization curves of the lower pair in Fig. 5 should be less far apart for the effective current densities of nickel deposition than are the curves obtained for total current densities. The lowering of current efficiency of nickel deposition by agitation is still more pronounced in the presence of easily reducible additives such as butynediol,71,72 because the increased supply rate of the additives, together with hydrogen ions, means increased use of current for their cathodic reduction and because the increased surface coverage by the additives may inhibit nickel deposition more than it inhibits hydrogen evolution, which it may even accelerate as is the case with coumarin.73,74 This reduction of current efficiency by agitation would shift the iNi (effective current density of nickel deposition) curve more to the left of the itotal curve in presence of agitation than in its absence. Thus, actual leveling should be greater than predicted from the upper pair of polarization curves in Fig. 5.
Although for abnormally high concentrations of additives neglect of current efficiency may lead to a considerable quantitative error in the prediction of the degree of leveling - but not in respect to the presence or absence of leveling - it should be remembered that the average current efficiency of an industrial nickel bath is in the middle and high current density range generally higher than about 94% (see, e.g., Ref. 3), and still higher for a leveling acid copper bath, so that the influence of current efficiency on leveling will be rather minor in such industrial baths.
It is difficult to predict the influence of current efficiency on microthrow from the cyanide baths of Fig. 6. It is known that increasing current density at a constant agitation rate decreases the cathodic current efficiency of such cyanide baths and that increasing agitation rate at constant current density increases their current efficiency. Thus, the opposite effects of increased agitation and increased current density may cancel each other out to a large extent.
4. Diffusion theories of leveling by Leidheiser and Watson and Edwards
It seems that the time was ripe for the development of a diffusion theory of leveling.
While we were conducting experiments to prove (or disprove) our diffusion theory of "bad microthrow" and "true leveling" and were preparing our two papers,1,2 we received Leidheiser's paper on "The Mechanism of Leveling during the Electrodeposition of Nickel in the Presence of Organic Compounds."4
Leidheiser sketched the outline of a theory according to which a greater number of sites for the deposition of nickel will be available in microrecesses than on micropeaks because of the hindered diffusion of organic molecules into the recess. Nickel ions arriving at the micropeaks and finding no free sites for deposition would travel on the surface - or near it - towards the recess area where more deposition sites are available.
Leidheiser related the degree of leveling to the excess polarization produced by the leveling agent. In an earlier paper Roth and Leidheiser75 had found that with many addition agents, agitation had the same effect on the cathode potential as an increase of the addition agent concentration. Surprisingly they did not make use of this finding for a more quantitative explanation of leveling, but it helped us in the conception of the idea to duplicate current distribution on microprofiles by varying the agitation rate on flat cathodes and observing the current density change produced at constant cathode potential. Already Raub and Wittum76 had observed increase of polarization by agitation in the presence of some nickel additives, and decrease in presence of others. The depolarizing effect of agitation in the absence of addition agents and at sufficiently high current densities was, of course, generally known.
In December, 1955, Watson and Edwards submitted their paper on the "Mechanism of Leveling in Electrodeposition"3 to the Council of the British Nonferrous Metals Research Association, but it was presented at the conference of the Institute of Metal Finishing only in April 1957. They proposed a mechanism of leveling practically identical with our own, namely diffusion-controlled inhibition by the leveling agent. Because of the greater diffusion rate to micropeaks as compared to microrecesses the incorporation rate and the inhibiting action of the leveling agent should be greater at the micropeaks. They proved the greater incorporation rate at the "micropeaks" - in this case the flat outside between two microgrooves, the rims of the groove and in some cases the upper part of the groove - by various etching techniques.
For their derivation of an equation for leveling power they made use of the analogy between limiting diffusion flow and primary current distribution, as Edwards had done before in his explanation of anodic smoothing.54
Instead of predicting leveling from the change of current density on a flat surface with agitation rate or δN as we had done, they predicted it from the change of current density with "equivalent bulk concentration." This method is justified if diffusion and consumption of the leveler occur at the limiting rate (see Eq. 15). Then increase of δN to nδN is equivalent to a decrease of CB to CB/n. Their method is less suitable if the metal deposition rate depends on the diffusion rate of several species, such as several addition agents, a leveling agent and the depositing metal ion at high i/iL, a leveling agent and the cobalt ion in nickel-cobalt baths,77 etc. In such cases, the change of current density with agitation rate, especially on the rotating disk or cylinder electrode, should give more correct predictions of leveling.
Watson and Edwards3 derived the following equation for leveling power:
(17)
where k is a constant characteristic of the profile shape, C is CB of the additive, and (dE/dC) and (dE/di) are the slopes of the corresponding polarization curves.
Thus, from two sets of polarization curves (E vs. CB at constant i, and E vs. i at constant CB) they predicted leveling and their plots of leveling power vs. concentration showed shapes similar to those of the curves obtained by plotting actual thickness ratios, obtained on electroformed phonograph record masters in Watts nickel baths containing coumarin, thiourea, etc., against CB.
Especially important is their discovery of the occurrence of maxima of leveling power, predicted from Equation 17 and actually measured, at certain concentrations of leveling agents such as coumarin and thiourea. The concentrations of leveling agents required to give maximum leveling increased with increasing current density. The concentration of coumarin required to give maximum leveling in a Watts nickel bath (pH = 4, 55°C, 2 A/dm2, vertically oscillating cathode), namely, between 0.00022 and 0.0004 M, was about the same whether phonograph record masters with microgrooves 20 μm deep and 32 μm wide, with a mutual distance of 100 μm, were used or diamond ruled surfaces with grooves only 0.1 μm deep and 1 μm wide. Leveling maxima will be discussed in more detail in Section 7.
Watson and Edwards also found that, in a coumarin-containing nickel bath, agitation increases cathode polarization (makes the cathode potential more negative) and that low concentrations of thiourea depolarize and produce "negative leveling" in contrast to the effect of higher concentrations, similarly to what we had found.
It is gratifying that two research groups have independently developed such similar ideas and have, by partly different experimental methods, come to the same conclusions.
5. Various methods for expressing the rate of leveling
In our paper1 we used thickness ratios, such as h4/h1, h3/h1 (see Fig. 7) because they should be most directly related to the ratios of (effective) current densities obtained with two rates of convective diffusion, one of which may be the one of natural convection, at constant cathode potential. The terms h1 and h2 are, of course, examples of "peak" thicknesses hp, and h3 and h4 of "recess" thicknesses hr. Because of the surface curvature at the groove rim, h2 is often somewhat smaller than h1 if the diffusion of a leveling agent is rate-controlling, and larger than h1 if the diffusion of the metal ion is rate-controlling. Both features can be seen in Fig. 8, where for the cyanide copper strike h2 > h1 and for the leveling nickel h2 < h1.

Figure 7 - Thickness measurements on microgrooves, from Foulke and Kardos.1,7
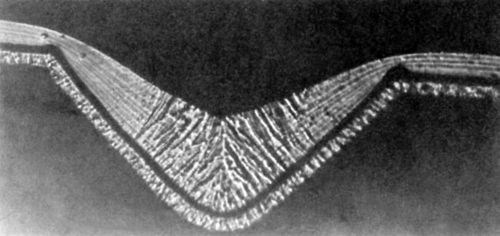
Figure 8 - Photomicrograph of a nickel deposit obtained in the presence of 0.2 g/L butynediol; initial groove depth 37.5 μm; from Foulke and Kardos.1,7
Figure 8 (0.2 g/L butynediol in an air agitated Watts bath, 50°C, pH = 3.0, 4 A/dm2) shows a fibrous structure in the lower half of the microgroove and a laminated structure in the relative peak areas. The latter is characteristic for higher bulk concentrations of butynediol than the former. Of course, the bulk concentration was the same, but the surface concentration and the surface coverage were apparently higher on the peak areas than in the recess areas. Figure 8 shows that the deposit at the bottom of the groove of thickness h3 has not grown from the groove bottom but rather from the side walls. To exclude this "geometric leveling" effect h4 rather than h3 should be used (See also Fig. 2 in Section 2).
For practical purposes, however, h3 is important, as the rate of leveling is often expressed by:
(18)
and dinitial - dfinal = h3 - h1 (See Fig. 7).
Equation (18) is also very suitable if surface roughness is measured with a stylus (or tracer) instrument. Then, the initial and final roughness values (arithmetic average, AA, or root mean square, RMS) are substituted for d.
Watson and Edwards3 defined leveling power as (ir - ip)/iav or as the corresponding thickness ratios (hr - hp)/hav; see Eq. (17). These and other expressions for leveling rates were discussed by DuRose.78 About measurement of surface roughness see also Refs. 17, 79-81.
Kruglikov and coworkers suggested measuring leveling on a sinusoidal profile and proposed the following equation for the leveling power P:
(19)
where a is the wavelength of the sinusoidal profile, hav the average deposit thickness and H0 and Hf the initial and final amplitudes of the profile. P is independent of deposit thickness.82
Bertorelle and coworkers82A measured leveling on pseudosinusoidal profiles, obtained by winding a fine metal wire around a suitable metal tube, by the decrease of the pseudosinusoidal amplitude. The fact that more than geometric leveling is obtained on such profiles shows that it is not due to shape sensitive adsorption because the initial surface curvature is the same over the wire except at the contact lines.
Related Content
Products Finishing Reveals 2024 Qualifying Top Shops
PF reveals the qualifying shops in its annual Top Shops Benchmarking Survey — a program designed to offer shops insights into their overall performance in the industry.
Read MoreSuccessful South African Plater Beating the Odds
Remaining focused on quality and reliability, Team Plating Works stays profitable in a volatile and challenging economy.
Read MoreHow to Maximize Nickel Plating Performance
The advantages of boric acid-free nickel plating include allowing manufacturers who utilize nickel plating to keep up the ever-changing regulatory policies and support sustainability efforts.
Read MoreTroubleshooting Alkaline Zinc
One of the most common problems that can arise when plating with alkaline zinc is an imbalance of brightener in the solution. In this helpful Ask the Expert article, Chad Murphy of Columbia Chemical discusses how different zinc metal concentrations and brightener concentrations can impact efficiency.
Read MoreRead Next
Education Bringing Cleaning to Machining
Debuting new speakers and cleaning technology content during this half-day workshop co-located with IMTS 2024.
Read MoreEpisode 45: An Interview with Chandler Mancuso, MacDermid Envio Solutions
Chandler Mancuso, technical director with MacDermid Envio discusses updating your wastewater treatment system and implementing materials recycling solutions to increase efficiencies, control costs and reduce environmental impact.
Read MoreA ‘Clean’ Agenda Offers Unique Presentations in Chicago
The 2024 Parts Cleaning Conference, co-located with the International Manufacturing Technology Show, includes presentations by several speakers who are new to the conference and topics that have not been covered in past editions of this event.
Read More




.jpg;maxWidth=300;quality=90)


