PF Podcast
Published

Development of Life Prediction Models for High Strength Steel in a Hydrogen Emitting Environment

Solvent substitution for maintenance and overhaul operations of military systems has been a primary environmental concern for many years. Cadmium replacement in these systems has been targeted for decades. Both of these areas have a common obstacle for implementation of any potential alternate. Hydrogen embrittlement of high strength steel is the most predominant unforeseen hurdle since high strength materials show sensitivity to the phenomena and the source of the hydrogen can be anything within the fabrication process, maintenance practice or the natural corrosion cycle. Standardized testing on this issue has traditionally stemmed from the aerospace industry where it is a principal focus.

Share

by Scott M. Grendahl, U.S. Army Research Laboratory Aberdeen Proving Ground; and Ed Babcock, Stephen Gaydos and Joseph Osborne, the Boeing Co.

 
ABSTRACT

Solvent substitution for maintenance and overhaul operations of military systems has been a primary environmental concern for many years. Cadmium replacement in these systems has been targeted for decades. Both of these areas have a common obstacle for implementation of any potential alternate. Hydrogen embrittlement of high strength steel is the most predominant unforeseen hurdle since high strength materials show sensitivity to the phenomena and the source of the hydrogen can be anything within the fabrication process, maintenance practice or the natural corrosion cycle. Standardized testing on this issue has traditionally stemmed from the aerospace industry where it is a principal focus.

A design of experiment (DOE) approach was used over a range of material strength for both air-melted (AMS 6415) and aerospace grade (AMS 6414) 4340 steel, load level and hydrogen environment. Five ASTM F-519 geometries were explored while monitoring load levels to determine a precise time to fracture at a specific notch fracture strength (NFS), material strength and hydrogen emitting environment (NaCl solution). This allowed comparisons across geometry and material to be drawn. Incorporating the failure time, load and stress levels into the failure models yielded predictive equations over broad parameter ranges. Reliable predictions of hydrogen sensitivity under specific conditions were then realized.

Ultimately, this work aims at evaluating the most prospective environmentally-friendly maintenance chemicals and cadmium alternative coatings that have their use limited by the perceived risk of hydrogen embrittlement. In subsequent years, this work will evaluate the prospective chemicals and coatings over a range of material strength, load level and hydrogen emitting environment which will demonstrate hydrogen sensitivity over parameter ranges, while developing life prediction models for each case. This should greatly increase the applications for which the replacements will be considered, as the models provide the acceptability criteria for the parameters specific to each application.

Keywords: Hydrogen embrittlement testing, hydrogen embrittlement prediction, high strength steels.
Objective
This work was designed to utilize a “Design of Experiment” (DoE) approach to create life prediction models for air-melted and vacuum arc re-melted (VAR) steel, SAE-AMS 6415 and SAE-AMS 6414 respectively.1,2 Common ASTM F-519 specimen geometries in combination with load cell measurement and time monitored experiments were used.3 The geometry that proved the most viable will be subsequently used to evaluate the most prospective environmentally-friendly maintenance chemicals and cadmium alternative coatings that currently have their use limited via the perceived risk of hydrogen embrittlement.
 
Materials
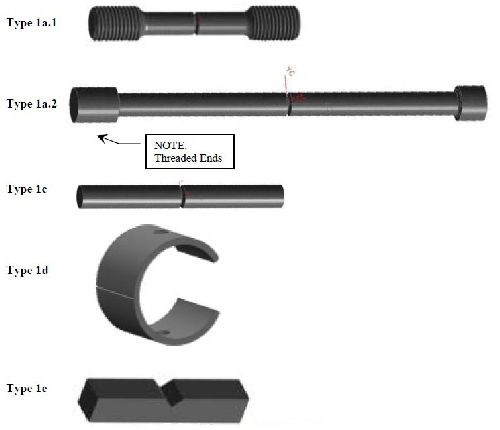
The five specimen geometries used, fabricated from SAE-AMS 6515 air-melted steel and SAE-AMS 6414 vacuum arc re-melted steel, were manufactured in accordance with the geometries of ASTM F-519 1a.1, 1a.2, 1c, 1d, and 1e specimens. These specimens are commonly used by nearly all of the aerospace industry and technical community for conducting hydrogen embrittlement research. They are depicted in Fig. 1.
 
 
Figure 1 - ASTM F-519 specimen geometries.
 
Heat treating
A critical element in conducting this comparative research across the five geometries was to have the material strength as close to identical as possible. This proved tedious as the stock removal differed on each specimen geometry in blanking and final machining. Additionally, production heat treating proved an imprecise process without tight control. Suppliers were not used to keeping such tight tolerances on their heat treated product. It was crucial to have the strength level of each specimen in a very narrow range (±5 ksi), otherwise data variation based on geometry might not be observable in the output. The team constructed a sub-matrix for the background work.
This process entailed certification of a rack-basket, hardening furnace and tempering furnace by normalizing, hardening and tempering samples to 280 ksi using small cylindrical buttons for in-process hardness tests and verification tensile samples. Once tested, verified and certified per mutually agreed parameters, furnaces and ovens had the process frozen for approval. The heat treatments of the actual specimens were completed within 30 days of the date of frozen planning approval. There were five heat treatment batches for this work across the five ASTM F-519 specimen geometries, 1a.1, 1a.2, 1c, 1d and 1e. Each batch of specimens, T1 thru T5, required heat treatment in accordance with the following:
• T1 = 140 ± 5 ksi (135-145 ksi)
• T2 = 158 ± 5 ksi (153-163 ksi)
• T3 = 210 ± 5 ksi (205-215 ksi)
• T4 = 262 ± 5 ksi (257-267 ksi)
• T5 = 280 ± 5 ksi (275-285 ksi)
 
The specimen counts varied by temper level following the overall design of experiments. The specimens were heat treated in batches according to their temper lot designation depicted in Table 1. The individual quantities were derived from the DoE matrix further explained in the experimental procedures section.
• T1 = 30 + 6 tensiles
• T2 = 75 + 6 tensiles
• T3 = 180 + 6 tensiles
• T4 = 75 + 6 tensiles
• T5 = 45 + 6 tensiles

Table 1 - Temper lot quantities.

Temper

Lot No.

Strength

Target,

ksi

No. of

specimens

1a.1

1a.2

1c

1d

1e

Total

+

Tensiles

T1

140

6

6

6

6

6

30

+

6

T2

158

15

15

15

15

15

75

+

6

T3

210

36

36

36

36

36

180

+

6

T4

262

15

15

15

15

15

75

+

6

T5

280

9

9

9

9

9

45

+

6

 
Cadmium plating
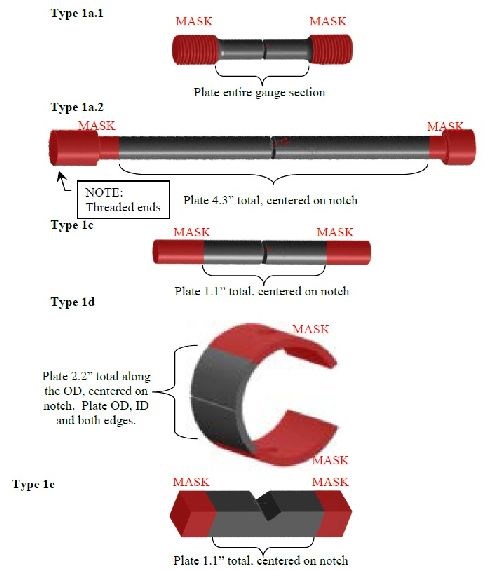
The plating requirements were critical since the surface area plated affects both the amount of hydrogen introduced into the sample and the free path out of the sample during HE bake relief. Specimens were supplied in the stress relieved condition to an aerospace industry approved cadmium plating vendor. The cadmium plating was LHE cadmium in accordance with MIL-STD 870 Rev. C. Type II, Class 1. The threads were masked and the specimens were post processed baked at 375 ± 25ºF within one hour of plating. Plating requirements were set so that each specimen would have an equivalent surface area-to-volume ratio during environmental testing, but were largely dependent on the allowable container size for holding the test fluid. The plating requirements were set such that no fluid would contact bare unplated steel during testing. The plated area of the specimens was in accordance with the Fig. 2.
 
 
Figure 2 - Masking/plating of the five specimen geometries.
 
Experimental procedures
Design of experiment (DoE)
This approach was used over a range of material strength, load level and hydrogen environment. The five geometries were tested while load levels were monitored to determine a precise time to fracture at specific percentages of notch fracture strength (%NFS), specific material strengths (heat treat tempers T1-T5) and specific hydrogen emitting environment (sodium chloride, wt% NaCl). Conversely to the existing standard, greater information was gleaned beyond the result of a pass/fail test. By incorporating the failure time, load and stress level data into DoE failure models, predictive equations over the broad ranges were developed.
The DoE focused on three variables for the five geometries (ASTM F-519 types 1a.1, 1a.2, 1c, 1d and 1e). The control variables were selected from risk reduction and ruggedness leveraged efforts conducted by The Boeing Company with the assistance of ARL. The five geometries were selected from the ASTM F-519 test method. Table 2 presents the range of test conditions for the five ASTM F-519 test geometries researched.
 
Table 2 - Design of experiment conditions matrix.

Condition

̶

0

+

Strength, ksi

140

158

210

262

280

Test load, %NFS

40

45

60

75

95

NaCl, wt%

1.25E-05

0.01

0.50

2.36

3.50

 
Below 140 ksi steel is generally accepted as not being sensitive to hydrogen, which sets the lower limit for strength. NaCl was not used at 0%, essentially completely deionized water, since the working group had experience that deionized water is actually severely corrosive and a very harsh environment for steel. It is also not a real world environment.

The design of experiment approach was refined with preliminary ruggedness and risk reduction efforts at Boeing Mesa, with technical assistance from Boeing St. Louis, Seattle, and ARL. Typical of DoEs, it consisted of three test portions, a linear portion, a quadratic portion and a confirmation portion. The example matrix is as presented in Tables 3 thru 5 with the condition values corresponding to Table 2. These experiments aided the development of appropriate boundary conditions for the larger effort.

Table 3 - Linear portion test matrix.

Repeat entire matrix 2× for 1a.1, 1a.2, 1c, 1d and 1e

Run

ID

A

B

C

Run

order

Strength, ksi

Test load, %NFS

NaCl,

wt%

Linear portion

L1

̶

̶

̶

Random

L2

̶

̶

+

L3

̶

+

̶

L4

̶

+

+

L5

+

̶

̶

L6

+

̶

+

L7

+

+

̶

L8

+

+

+

Center points

C1

0

0

0

C2

0

0

0

C3

0

0

0

C4

0

0

0

C5

0

0

0

C6

0

0

0

 
Table 4 - Quadratic portion test matrix.

Repeat Q1-Q6 5× for 1a.1, 1a.2, 1c, 1d and 1e

Run

ID

A

B

C

Run

order

Strength, ksi

Test load, %NFS

NaCl,

wt%

Not replicated

C7

0

0

0

First

Quadratic portion

Q1

+α

0

0

Random

Q2

-α

0

0

Q3

0

+α

0

Q4

0

-α

0

Q5

0

0

+α

Q6

0

0

-α

Not replicated

C8

0

0

0

Last

 
Table 5 - Confirmation portion test matrix.


Run

ID

A

B

C

Run

order

Strength, ksi

Test load, %NFS

NaCl,

wt%

Confirmation portion

1

Varied, depending on outcome of Linear, Center and Quadratic Results

Random

2

3

4

5

6

7

8

9

10

11

12

13

14

15

16


After the linear and center point data runs were completed, initial calculations were made for the predictive model equations. Those initial models were utilized to choose confirmation runs to be researched. The confirmation run results were then incorporated into refining the initial working model.
Specimens, environments and loading procedure
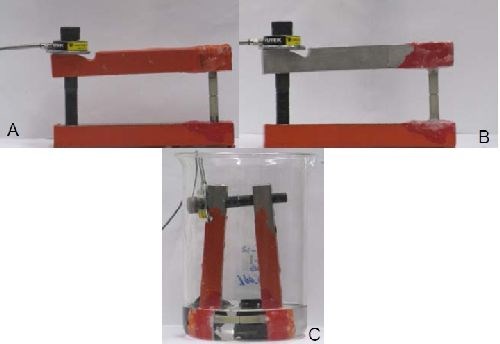
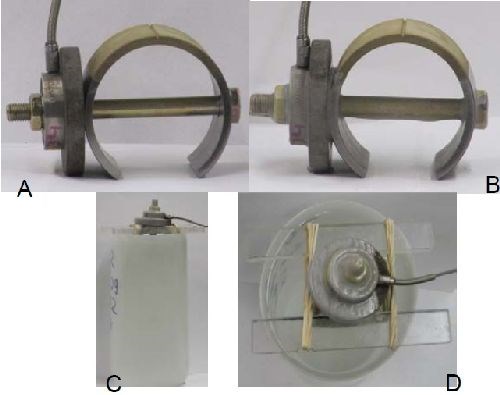
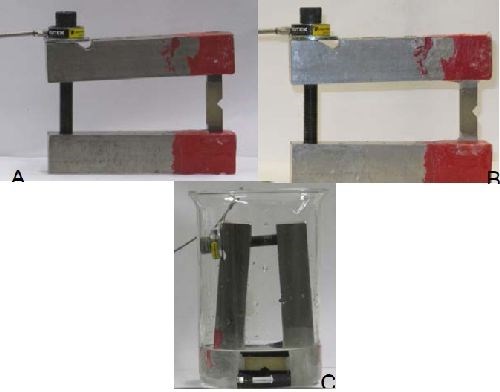
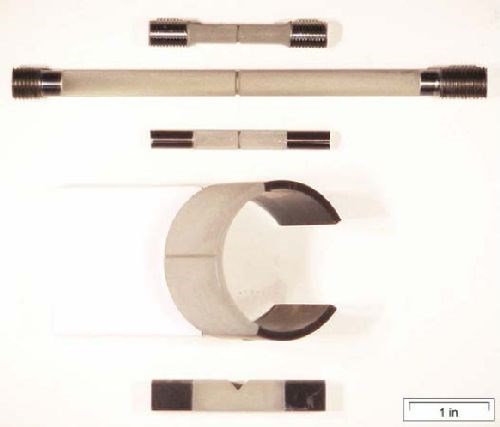
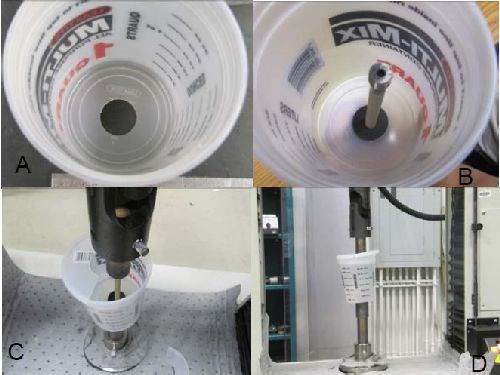
The 4340 steel samples in five ASTM F-519 geometries and heat treated to five different material strengths, as previously described, were tested. The specimens demonstrated adequate hydrogen sensitivity of the material conducted in accordance with ASTM F-519. The cadmium plated specimens used for these experiments are depicted in Fig. 3. The axially loaded specimens (geometries 1a.1 and 1a.2) were tested on Instron or MTS uniaxial load mechanical test frames; the 1c and 1e specimens were loaded with double cantilever bending fixtures and the 1d specimens were directly loaded with nut and bolt. The loads were monitored with the load cells on the mechanical test frames and via loading rings installed in the load path for the other geometries. The load cells and load rings were calibrated prior to the experiments. For this work, loads were applied as a percentage (45% - 95%) of the calculated 100% notch fracture strength (NFS) determined for each geometry. Ten specimens were utilized to calculate the average 100% NFS with the identical fixturing applied during the experiments. Ten specimens from each group were loaded to failure. The experimental loading was then applied as a percentage of this determined average NFS failure load. Loads were recorded from the mechanical test frames for geometries 1a1 and 1a.2, and with data sampling hardware and software for the other geometries. Figures 4 thru 7 depict the in-situ test apparatus for the experiments.
The samples were cadmium plated at in accordance with MIL-STD-870 Rev. C. Type II, Class 1. Plated samples were sensitivity tested in accordance with ASTM F-519. Cadmium plating process embrittlement testing involved loading three T5 samples from each geometry to 75% of their NFS and holding for 200 hr in air. These specimens did not fail, and thus insured that the plating process did not embrittle the specimens.
 
 
Figure 3- Cadmium plated experimental specimens (top to bottom; 1a.1, 1a.2, 1c, 1d and 1e).
 
 
Figure 4 - Geometry 1a.1 and 1a.2: (A) the empty container, (B) the sample in the cup, (C) the sample loaded onto the mechanical test frame and (D) the sample being tested in solution.
 
 
Figure 5 - Geometry 1c in-situ environmental set-up: (A) loaded, (B) loaded and masked and (C) being tested in solution.
 
 
Figure 6- Geometry 1d in-situ environmental set-up: (A) loaded, (B) loaded and masked, (C) being tested in solution and (D) top-down perspective.
 
 
Figure 7 - Geometry 1e in-situ environmental set-up: (A) loaded, (B) loaded and masked and (C) being tested in salt water.
 
The specimens were masked so that only the cadmium-plated surface contacted the test solution. The solution used was NaCl in deionized water in five different concentrations: 1.25e-5 wt%, 0.01 wt%, 0.50 wt%, 2.36 wt% and 3.50 wt% in accordance with Table 2. The volume of NaCl solution for each sample geometry was calculated to ensure that each geometry had the same ratio of cadmium-plated surface area to solution volume. If this volume was not enough to submerge the samples adequately, clean inert material was added to displace solution in order to submerge the samples to the correct level. The loaded specimens were then immersed in the test solution for the duration of the experiment. Specimens were removed either upon failure or after 168 hr of sustained load without failure. The result of each individual test run for each geometry can be found in the appendices.

As stated previously, upon conclusion of the linear, center and quadratic test runs, preliminary life prediction models were created. These models were then used in the confirmation test portion of the matrix to choose appropriate parameters to both enhance and verify the model. Final life prediction equations and three dimensional models were created after the incorporation of the confirmation data.

Results
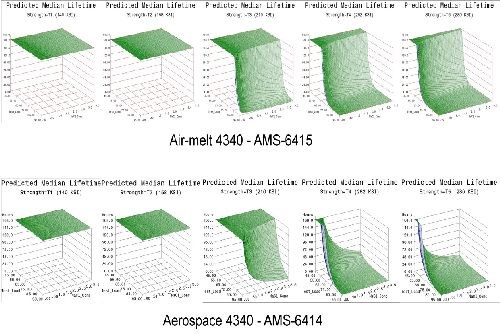
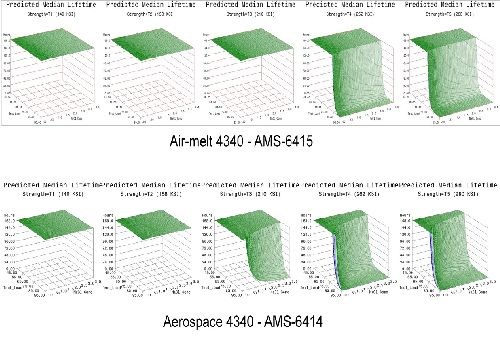
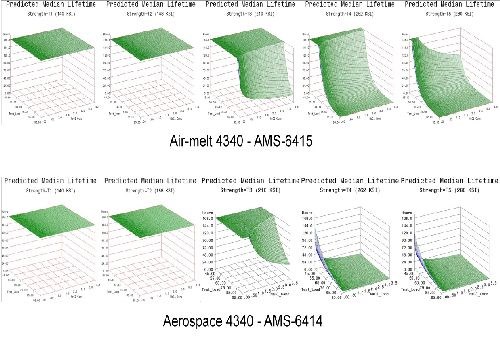
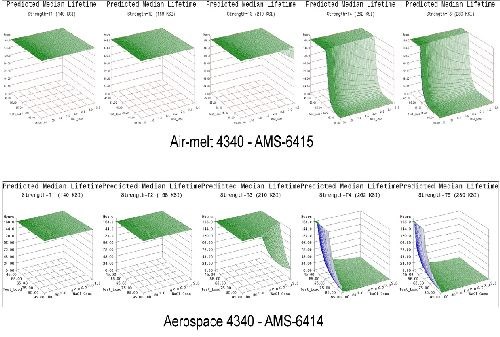
The following section presents the preliminary and final model equations for each geometry and material. The final graphical life prediction model for each is shown in Figs. 8 thru 12, for types 1a1, 1a2, 1c, 1d and 1e respectively. The final life prediction models, for each respective geometry and material, did not vary significantly from the preliminary set, thus verifying the initial prediction. The variables in the models are material strength, test load and NaCl concentration. The model transformations of these variables were as follows:
 
Strength = Str = (Material strength (in ksi)-210)/52 (1)
Load = (Test Load (in %NFS)×0.0444)-3.2222 (2)
NaCl = (Wt% NaCl)×1.782-1.376 (3)
 

Air-melted SAE-AMS-6415 steel

1a.1 Preliminary Model

ln(T) = 7.20-5.09×Str-2.43×Load-1.02×NaCl-2.43×Str×Load+Offset (4)

where

Offset = σ×ln(-ln(1-P)) (4a)

for which

T = time to event. It is either the time to failure or the time to the end of the experiment (168 hr).

P = the predicted percentile. At a P of 70%, 70% of the failures would be above the curve and 30% would fall below the curve generated.

σ = 1/Weibull shape parameter. Weibull shape parameter = 0.579.

  • A negative value of the coefficient is indicative of a shorter lifetime as the variable increases.
  • Weibull shape < 1 → hazard rate (failure rate) decreases as time increases.
  • Infant mortality. After initial early failures the survival improves with age.

1a.1 Confirmation Model

ln(T) = 6.77-4.98×Str-1.29×Load-0.93×NaCl-3.66×Str×Load+Offset (5)

Weibull shape parameter = 0.567

1a.2 Preliminary Model

ln(T) = 9.09-5.49×Str-7.39×Load-1.39×NaCl+Offset (6)

Weibull shape parameter = 0.377

1a.2 Confirmation Model

ln(T) = 8.75-5.90×Str-6.53×Load-1.33×NaCl+Offset (7)

Weibull shape parameter = 0.397

1c Preliminary Model

ln(T) = 19.01-11.67×Str-9.93×Load-0.88×NaCl+Offset (8)

Weibull shape parameter = 0.343

1c Confirmation Model

ln(T) = 20.91-10.53×Str-11.30×Load-1.25×NaCl+Offset (9)

Weibull shape parameter = 0.278

1d Preliminary Model

ln(T) = 7.83-4.04×Str-3.54×Load-1.01×NaCl+Offset (10)

Weibull shape parameter = 0.515

1d Confirmation Model

ln(T) = 7.68-4.12×Str-3.08×Load-6.04×NaCl+Offset (11)

Weibull shape parameter = 0.546

1e Preliminary Model

ln(T) = 12.31-7.45×Str-6.45×Load-0.97×NaCl+Offset (12)

Weibull shape parameter = 0.505

1e Confirmation Model

ln(T) = 13.14-8.16×Str-6.58×Load-0.73×NaCl+Offset (13)

Weibull shape parameter = 0.493

Vacuum Arc Re-melted SAE-AMS-6414 steel

1a.1 Preliminary Model

ln(T) = 5.20-4.79×Str-2.22×Load-1.73×NaCl-1.24×Str×Str+Offset (14)

Weibull shape parameter = 1.090

1a.1 Confirmation Model

ln(T) = 5.66-5.28×Str-2.82×Load-1.52×NaCl-1.29×Str×Str+Offset (15)

Weibull shape parameter = 0.913

1a.2 Preliminary Model

ln(T) = 7.90-5.20×Str-3.00×Load-1.77×NaCl+Offset (16)

Weibull shape parameter = 0.643

1a.2 Confirmation Model

ln(T) = 7.69-7.73×Str-2.93×Load-1.57×NaCl-2.40×Str×Str+Offset (17)

Weibull shape parameter = 0.644

1c Preliminary Model

ln(T) = 11.35-8.27×Str-5.96×Load-3.2×NaCl-2.5×Str×Str+Offset (18)

Weibull shape parameter = 0.548

1c Confirmation Model

ln(T) = 11.6-8.19×Str-6.49×Load-2.92×NaCl-2.34×Str×Str+Offset (19)

Weibull shape parameter = 0.541

1d Preliminary Model

ln(T) = 6.63-6.85×Str-1.40×Load-0.95×NaCl-2.80×Str×Str+Offset (20)

Weibull shape parameter = 1.234

1d Confirmation Model

ln(T) = 6.52-6.58×Str-1.08×Load-0.99×NaCl-2.60×Str×Str+Offset (21)

Weibull shape parameter = 1.237

1e Preliminary Model

ln(T) = 9.08-11.04×Str-1.68×Load-2.21×NaCl-4.29×Str×Str+Offset (22)

Weibull shape parameter = 0.646

1e Confirmation Model

ln(T) = 8.92-9.56×Str-1.93×Load-2.18×NaCl-3.26×Str×Str+Offset (23)

Weibull shape parameter = 0.695
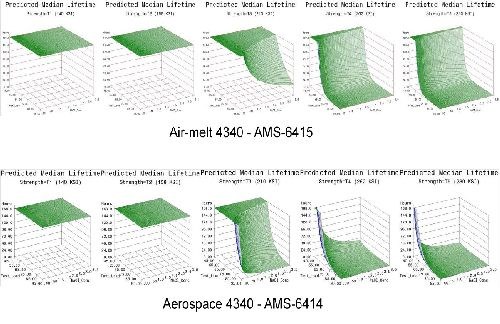
Figure 8 - Final 1a.1 specimen geometry life prediction models.
 
 
Figure 9 - 1a.2 specimen geometry life prediction models.
 
 
Figure 10 - Final 1c specimen geometry life prediction models.
 
 
Figure 11 - Final 1d specimen geometry life prediction models.
 
 
Figure 12 - Final 1e specimen geometry life prediction models.
 
Discussion
Since this type of predictive model had never been attempted before to assess hydrogen sensitivity, the results were extremely satisfying. The predictive models express hydrogen sensitivity in terms of applied load, material strength and hydrogen environment. In this case, the hydrogen environment is a representation of the natural environmental corrosion cycle. In terms of NaCl concentration, 3.5% is widely accepted to be the worst case scenario for the corrosion of steel. Values higher than 3.5% actually result in a lower corrosion rate. The time duration, 168 hr, is above that which is accepted as the lifetime cutoff for service environments, 150 hr. Essentially, this data suggests that if the material demonstrates no hydrogen sensitivity in a 3.5% salt concentration environment for 168 hr at a specific strength and applied load combination, then it should not be expected to fail in a lifetime of service exposure in our natural environment at that strength and applied load level. The “safe zone” in the graphical representation of the models is the area below the curves.
 
By comparing all of the models across test geometry, it can be seen that the 3.5% NaCl is not a sufficiently severe environment to cause hydrogen embrittlement at or below the 158 ksi strength level. The “T1, 140 ksi” and “T2, 158 ksi” strength levels are flat, showing no sensitivity. This does not mean that in an environment that emits more hydrogen, no sensitivity would be expected. The converse is true. Industrial processes like electroplating, or acidic or alkaline cleaning would certainly be expected to show sensitivity to hydrogen at or near the 158 ksi material strength level.
 
Although varying performance can be observed across test geometry, the trends are certainly in agreement. The sensitivity increases with material strength level, applied load, and to a lesser degree, with NaCl concentration. All of these trends are in-line with traditional expectations. While the material strength level is typically given consideration with regard to hydrogen sensitivity, applied load is often forgotten. Residual stresses from forming, quenching or from assembly can often reach 40-45% of the UTS. This is important to remember since these life prediction models show sensitivity beginning at or even below that region. This supports traditional findings where components sometimes break on the shelf while waiting to be placed in service. When combined with a design stress or in-service applied stress, catastrophic failure is much more likely to occur. The degree of heightened sensitivity from applied stress was unknown before now, since it has never been investigated.
 
It can also be observed in the data that the 1d geometry shows the highest sensitivity. It has the highest stress intensity, stemming from the smallest notch root radius. It also has historically performed in comparative tests with heightened sensitivity. While this test geometry may not be representative of every application in terms of stress intensity, one would be able to apply a factor of safety to this life prediction model and have confidence that a similar application would not fail due to hydrogen embrittlement. All the models have similar trends, but a risk analysis would likely scale from a worst case and not middle of the pack performance. The 1d geometry is also a self-loading geometry, so it is conducive to testing in various environments since no mechanical test frame is needed.
 
Conclusions
The following conclusions can be drawn from the data developed in this work.
  1. Life prediction models were developed that accurately represent the expected hydrogen sensitivity over the range of parameters explored for air-melted and vacuum arc re-melted 4340 steel.
  2. The trends observed in the data were reasonably consistent across all test geometries. Sensitivity increases with applied load, material strength and to a lesser degree NaCl concentration.
  3. Applied stress has the most direct effect on hydrogen sensitivity, while material strength is a close second. Increasing the value of either parameter directly heightens the sensitivity to hydrogen.
  4. 4340 steel does not appear susceptible to hydrogen absorbed from environmental corrosion below the 160 ksi strength level.
  5. High residual stress levels (40-50% of UTS) are capable of causing hydrogen embrittlement without further applied system stresses.
  6. The 1d test geometry proved the most sensitive to hydrogen and also conducive to testing multiple specimens in various environments without requiring test load frames.
  7. Vacuum arc re-melted steel was more susceptible to hydrogen than air-melted 4340 steel in this environment.
  8. Vacuum arc re-melted steel was more sensitive to NaCl concentration than air-melted 4340 steel.
 
References
  1. SAE-AMS 6415S-2007, Steel, Bars, Forgings, and Tubing 0.80 Cr - 1.8 Ni - 0.25 Mo (0.38 - 0.43 C), SAE World Headquarters, Warrendale, PA, 2007.
  2. SAE-AMS 6414K-2007, Steel, Bars, Forgings, and Tubing 0.80 Cr - 1.8 Ni - 0.25 Mo (0.38 - 0.43 C) (SAE 4340) Vacuum Consumable Electrode Remelted, SAE World Headquarters, Warrendale, PA, 2007.
  3. ASTM F-519-10, Standard Test Method for Mechanical Hydrogen Embrittlement Evaluation of Plating/Coating Processes and Service Environments, ASTM International, West Conshohocken, PA, 2010.
  4. MIL-STD-870C, Department of Defense Standard Practice: Cadmium Plating, Low Embrittlement, Electro-Deposition, 2009.


Luster-On Products
PF Podcast
Heatmax Heaters ad with immersion heaters
Metal Pretreatment Technology
Gardner Intelligence
Pretreatment Washer and Finishing Equipment
Heatmax Heaters ad with immersion heaters
The Finishing Industry’s Education and Networking Resource
Filtration Systems
PMTS 2025 Register Now!
New Acid-Free Bright Nickel Process
find masking products online

Related Content

Anodizing

Pulling Out All the Stops

Evolving coatings and finishes for automotive brake components. 

Read More
racking

Chicago-Based Anodizer Doubles Capacity, Enhancing Technology

Chicago Anodizing Company recently completed a major renovation, increasing its capacity for hardcoat anodizing and Type II anodizing.

Read More
aerospace

A Smooth Transition from One Anodizing Process to Another

Knowing when to switch from chromic acid anodizing to thin film sulfuric acid anodizing is important. Learn about why the change should be considered and the challenges in doing so.

Read More
Anodizing

Understanding PEO Coatings

Using high-speed cameras and back side illumination (BSI) sensor technology to analyze plasma electrolytic oxidation. 

Read More

Read Next

Parts Cleaning

Education Bringing Cleaning to Machining

Debuting new speakers and cleaning technology content during this half-day workshop co-located with IMTS 2024.

Read More
Sponsored

Delivering Increased Benefits to Greenhouse Films

Baystar's Borstar technology is helping customers deliver better, more reliable production methods to greenhouse agriculture.

Read More
Pollution Control

Episode 45: An Interview with Chandler Mancuso, MacDermid Envio Solutions

Chandler Mancuso, technical director with MacDermid Envio discusses updating your wastewater treatment system and implementing materials recycling solutions to increase efficiencies, control costs and reduce environmental impact.

Read More
Non-Cyanide Silver Plating, AMS 2411J