The Profit Hunt: Finding the Hidden Cost of Electrocoat
Determining real costs means competing in deflationary times.
Operating an efficient and profitable electrocoat system is a lot like operating any other plant: The product must meet customer requirements; the system must be maximized to its full capacity; costs must be minimized; and consistent, quality product must be produced.
When applying this concept to electrocoat, it means hanging as much metal as possible while maintaining—or improving—quality and minimizing applied cost per square foot.
When selecting an electrocoat product, the first step is narrowing the field of products to those which will meet the desired durability/physical property requirements. The next step is to evaluate the applied cost of the product. This is more than just dollars per gallon. The real measure is cost per square foot, because buying a gallon of paint isn’t like buying a gallon of milk: different paints provide different coverage because they have different feed solid contents and bake losses.
It is these two factors that determine the square feet per gallon that can be expected from a product. Table 1 shows how widely these values can vary in the epoxy electrocoat market, greatly affecting the applied cost.
Transfer Efficiency Neglects The Bake Loss
The coverage at 100 percent transfer efficiency (TE) is very often reported as the coverage for an electrocoat coating. However, this value neglects the bake loss of the coating. As the coating is cured in the oven, the film shrinks. This is called bake loss or film shrinkage. Most parts will have a film thickness requirement, so increased paint application of a high-shrinkage product is needed to provide the same film build as a lower-shrinkage product.
The last column in Table 1 shows the real coverage of an electrocoat product with 1.0 mil film build. This value neglects any paint loss through system inefficiencies such as paint drag-out and non-uniform film distribution, but this enables the products to be compared on an apples-to-apples basis. System efficiencies affect all products similarly, and film-build distribution will be dealt with next. Looking at how widely the coverage varies, the applied cost can be as much as 20 percent higher, even at the same cost per gallon.
The hidden cost to be addressed in the product selection is the degree of film-build uniformity of a product. This is the cost of electrocoat that has been primarily ignored in the past.
Electrocoats are widely beneficial for their ability to provide film uniformity compared with other coatings. E-coat throwpower has long been a benefit in automotive assembly plants for its ability to provide corrosion protection in recessed areas of vehicles, such as rocker panels.
Value Of Throwpower
In recent years, the value of throwpower has been investigated as a potential cost-reduction tool for densely packed parts in an electrocoat tank, which is fundamentally important to system efficiency and profitability. When part racking has a very low density, film thicknesses can be very uniformly applied to all parts. At higher densities, the outer parts shield the inner parts from the anodes, decreasing the film thickness in the interior rack regions.
As a result, the film build is less uniform, leading to waste on the exterior parts. This degree of waste is a function of how densely the parts are racked and the electrocoat product chosen. When using a superior throwpower e-coat, there is less film build variation and consequently less paint consumption. The goal is to quantify how much waste this excess paint application contributes.
In order to evaluate how this affects the overall consumption, a superior throwpower e-coat was compared to a standard throwpower electrocoat at different rack densities. An electrocoat industry rule of thumb has generally limited rack density to approximately 3 to 5 sq ft/cu ft (coated surface area/rack volume).
Using this limit as a starting point, the film build distribution was evaluated at rack densities of 5.6 sq ft/cu ft and 11.3 sq ft/cu ft. Starting with the medium rack density of 5.6 sq ft/cu ft, the superior and standard throwpower electrocoats were applied to panels, targeting a minimum film thickness of 0.8 mils or 20 microns.
Dimensional Film-Build Distributions
While maintaining this interior minimum, the exterior film thicknesses were allowed to increase as necessary with increased rack density.
When comparing standard and superior throwpower, it was clear that the film build distribution was greater in the standard e-coat compared with the superior throwpower e-coat. In order to meet a minimum film thickness of 0.81 mil or 20.5 microns, the standard throwpower e-coat had an average film thickness of 0.95 mils (24.2 microns), and the superior throwpower e-coat had an average film thickness of 0.86 mils (21.8 microns). This resulted in 16.2 percent and 5.6 percent excess consumption in the standard and superior throwpower e-coat, respectively for a difference of more than 10 percent between the two electrocoats.
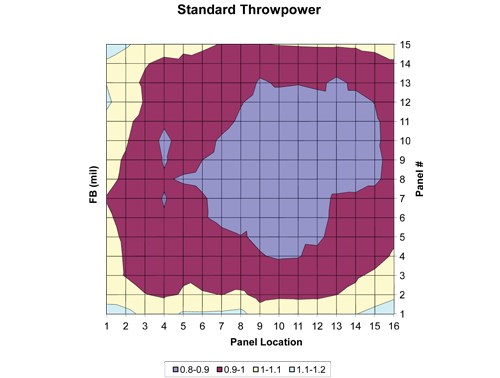
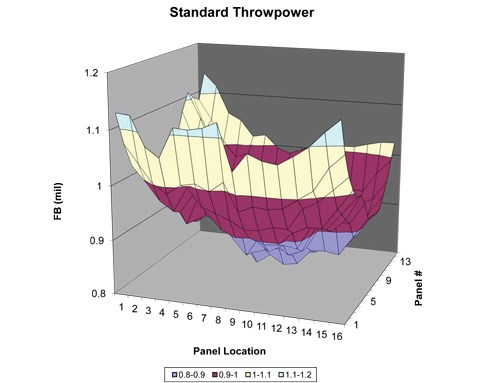
Moving on to the high rack density trial of 11.3 sq ft/cu ft, you can look at the three-dimensional film-build distributions and two-dimensional contour plots for the standard and superior throwpower products, respectively.
Comparing Standard, Superior Throwpower
When comparing the information as a two-dimensional and three-dimensional chart, an even greater difference in the film-build distribution was observed comparing the standard and superior throwpower e-coats. In order to meet a minimum film thickness of 0.81 mil or 20.5 microns, the standard throwpower e-coat had an average film thickness of 1.13 mils (28.6 microns), and the superior throwpower e-coat had an average film thickness of 0.87 mils (22.2 microns).
This resulted in 36.5 percent excess usage in the standard throwpower e-coat and only 7.8 percent excess usage in the superior throwpower e-coat for a difference of almost 30 percent between the two electrocoats. Furthermore, when increasing the rack density, the superior throwpower e-coat had very little change in average film build (0.86 mil compared with 0.87 mil).
Clearly, the use of a superior throwpower e-coat can have a substantial impact on the bottom line, especially at high rack densities. The chart on page 19 shows the percentage excess paint consumption of both the standard and superior throwpower e-coats versus rack density.
Conclusions
Based on the work above, the following conclusions can be made:
- When examining the application costs of e-coat products, the following must be factored into the total costs for that product:
- Cost/gallon of material
- Volume non-volatiles of the product
- Coverage per gallon (sq ft/gal) at 100 percent TE
- Shrinkage or bake loss of product
- Inefficiencies of the product due to non-uniform film distribution.
Using superior throwpower electrocoats can decrease overall paint consumption by as much as 30 percent compared with standard throwpower e-coats at high rack densities due to more uniform film distribution obtained and is a major factor in decreasing overall applied cost. n
For more information on BASF Corporation, please call 248-948-2534 or visit BASF-coatings.com.
Related Content
TTX’s Automated Conveyor Carrier System Offers Wireless, Flexible Operation
ACC system designed for reliable, consistent point-to-point movement of everything from small to heavy parts.
Read MoreTop Shop Leader Focuses on Its People as Key to Success
Twin Cities job shop, Avtec, was named a Top Shop for the third time in 2022, due in no small part to its commitment not only to the work it produces but to those who produce it — its employees.
Read MoreConveyors and Paint Systems
Choosing the right conveyor system, coating technology, and ancillary equipment.
Read MoreCFS Unveils New Hook Locks Parts Racking Solution
New product from Custom Fabricating & Supplies (CFS) prevents part loss during coating processes.
Read MoreRead Next
A ‘Clean’ Agenda Offers Unique Presentations in Chicago
The 2024 Parts Cleaning Conference, co-located with the International Manufacturing Technology Show, includes presentations by several speakers who are new to the conference and topics that have not been covered in past editions of this event.
Read MoreEducation Bringing Cleaning to Machining
Debuting new speakers and cleaning technology content during this half-day workshop co-located with IMTS 2024.
Read More


.jpg;maxWidth=300;quality=90)


