Electroplating, Electrochemistry and Electronics - The 15th William Blum Lecture - Part 1
This article is the first of four parts of a re-publication of the 15th William Blum Lecture, presented at the 61st AES Annual Convention in Chicago, Illinois, on June 17, 1974. Dr. George Dubpernell reviews the history and extent of commercial plating, then delves into the electrochemical science, including potentials, overvoltage and connections to electronics.
by
George Dubpernell
M&T Chemicals
Ferndale, Michigan
Recipient of the 1973 William Blum
AES Scientific Achievement Award
Editor’s Note: Originally published as Plating & Surface Finishing, 62 (4), 327-334 (1975), this article is the first of four parts of a re-publication of the 15th William Blum Lecture, presented at the 61st AES Annual Convention in Chicago, Illinois, on June 17, 1974. A printable PDF version of Part 1 is available by clicking HERE. The printable PDF version of the complete 44-page paper is available HERE.
ABSTRACT
A brief review is given of the history of the electrodeposition of metals and of the formation of the American Electroplaters' Society. The extent of the commercial plating of different metals is discussed. A new point of view is given on the nature of electrode potentials, including some new experimental data and examples of the place of hydrogen overvoltage in metal deposition. It appears that "overvoltage" is probably an electronic property of the surface of the electrode, and may be intimately related to the "surface states" commonly postulated in electronics. If the suggested relationship is correct, overvoltage measurement may possibly provide a new tool for electronic studies of metal and probably also semiconductor surfaces. Some of the relatively close relationships which exist between electroplating, electrochemistry and electronics are pointed out.
Historical
Electroplating had its beginnings in 1800, as soon as Volta announced the discovery of the voltaic pile, or primary battery, as a source of power.1,2 Thus, plating was a battery powered industry for almost a century, and it was not until around 1880-1900 that direct current generators took over the major portion of the power supply. Following the introduction of commercial nickel plating in 1869-1870,3 it was not long before dynamo electric machines started to be used on a small scale.
Edward Weston was quick to seize this opportunity and to fill the need, particularly since he failed to break the patent monopoly on nickel.3 Abraham Van Winkle was one of his backers.4 Thus, the 1876 catalog of Condit, Hanson and Van Winkle featured the Weston Dynamo-Electric Machine in four sizes. The names of over 30 purchasers of the machines were listed, and in just a few years these numbered in the hundreds.
A Metal Polishers Union was formed in 1880 by Charles Ernest of the Michigan Stove Company, with Local No. 1 in Detroit, Michigan.5 This union was at first part of the Knights of Labor, but in 1889 became affiliated with the American Federation of Labor, and later on, probably in the 1930s, also with the C.I.O. It published a monthly Metal Polishers Journal beginning in 1890, and this magazine continues right down to the present under the title Metal Polisher, Buffer and Plater. However, this journal is confined almost entirely to union matters, with only an occasional technical article, generally a reprint from other sources.
The American Electroplaters' Society was formed by Charles H. Proctor and others to meet the needs of foreman platers for more knowledge of chemistry and electrochemistry. Mr. Proctor presented a paper on the electrodeposition of brass in 1907 at the first convention of the newly formed American Brass Founders' Association, a splinter organization of the American Foundrymen's Association, and suggested the formation of another sub-group, a Platers and Polishers Association.6 This suggestion was favorably received, but Mr. Proctor decided that it would be better to form an entirely independent organization, which he succeeded in doing in March and April, 1909, the National Electro-Platers' Association of the United States and Canada (NEPA).7
The American Foundrymen's Association dropped its activities directed to the formation of a platers sub-group as soon as the NEPA was successfully launched. The NEPA was converted to the American Electroplaters' Society as of June 1, 1913.8
The newly-formed National Electro-Platers' Association (NEPA) divorced itself completely from the Metal Polishers Union.9 The 30,000 member union tried to discourage the growth and activities of the new Society for several years, but the Society adhered firmly to its educational goals and maintained its separate existence. This situation explains why the early lists of Branch officers included a sergeant-at-arms who was posted at the door of the meeting place and checked to see that only bona fide members entered.
Another pre-AES publication was a little supply house magazine called The Plate and published monthly from January, 1909, to October, 1909, by the Dow Chemical Mfg. Co. of Mansfield, Ohio, unrelated to the Dow Chemical Mfg. Company of Midland, Michigan. This little magazine was edited to a considerable extent by Herbert J. Hawkins, but seems to have been discontinued when it became apparent that the new NEPA would soon be publishing a journal, something which actually came to pass about a year later, in the fall of 1910.
The Periodic Chart
A long-period chart of the elements, most suited for use in electroplating studies is reproduced here (Fig. 1) with the most recent changes and additions included. When this chart was first published by the writer in 1946,10 he had been using it regularly from 1926 on. In the meantime, similar charts were published by Ellingham11,12 and Blum.13 In discussing the writer's chart, Dr. Blum was kind enough to call it "the plater's road map," which indeed it is.

Figure 1 - Periodic chart emphasizing the metals easily electroplated at high current efficiency from aqueous solution.
By means of this chart one can obtain some guidance as to the probable plating behavior of a given metal, and the best choice of solution composition for obtaining deposits of it. This is done primarily by analogy to the already known chemistry and physics of the neighboring elements.14 Similarly, elements close to each other in the chart are more likely to deposit together as an alloy from a mixed solution, than elements at a distance from each other.
It is interesting that it appears that the more newly-discovered elements give promise of being readily electrodeposited from aqueous solution. Thus, there was speculation on the possible discovery of element No. 112.15 If this is confirmed, the new element would occupy a position under mercury, No. 80, and presumably would be easy to isolate by electrodeposition.
The consumption of metals in electroplating
The various metals deposited commercially in the United States will be discussed in alphabetical order. While there are changes from time to time, these are generally slow in arriving, and on the whole the figures are remarkably stable from year to year. Some discussion of the electrolytic production of metals is included, but electrolytic refining is omitted.
The sources of information on the annual consumption of metals in electroplating are quite limited; frequently one is restricted to the personal estimates of individual experts having some knowledge. Even these may vary widely and merely serve to indicate the order of magnitude.
The chief sources of information are the annual report of the U.S. Bureau of Mines on the Mineral Industry in the Minerals Yearbook and the Metal Statistics published annually by the American Metal Market Company. These are useful for total metal production, and also have the consumption in electroplating in some instances. In some cases the% of the production used for electroplating is known approximately and can be used for an estimate.
An excellent review was given by F.T. Taylor in 1929.16 Dr. Blum gave a few figures in 1953.17 A more recent German review has some information.18 Sometimes an article will give information on an individual metal, but this is not common. The writer made surveys of United States consumption in 1953 and 1968 which form the basis for the summaries below.
Brass
An estimate of 1,000,000 to 1,200,000 lb./yr. was given for 1968 by the True Brite Chemical Products Company. This is used largely on such items as builders' hardware and light fixtures. Brass plating is an old industry dating back to the introduction of cyanide solutions, and a patent of von Ruolz in 1841. Currently, a white brass plate is also used as one of the undercoats for decorative chromium plating.19
Cadmium
The Udylite Corporation gave a figure of about 7,200,000 lb. of cadmium used for plating in 1968, and 6,871,000 lb. in 1953. The latter figure checks with a 1953 estimate from the U.S. Bureau of Mines of 6,500,000 to 7,000,000 lb. The stability of these figures reflects the fact that the cadmium available is mainly a by-product of zinc production, and thus limited. Cadmium is used as a silvery-appearing rustproof plate. Its use began about 1920, and Taylor gave a consumption of about 1,300,000 lb./yr. in 1929.16 Dr. Blum estimated about 4,000,000 lb./yr. in 1948.17
Chromium
M&T Chemicals Inc. indicated that about 35,000,000 lb./yr. of chromic acid was used for chromium plating in 1968, compared to a figure of about 20,000,000 lb./yr. in 1953 from the Mutual Chemical Company. .A still more recent estimate is that about 40,000,000 to 42,000,000 lb. of chromic acid was used for chromium plating in 1971. This is based upon about 80-81% of the production being used in plating (90% for metal finishing and 90% of that for chromium plating). An annual production figure is given by the U.S. Department of Commerce.20 The figure for 1972 would indicate roughly about 44,000,000 lb. of chromic acid used for plating in 1972.
Chromium plating started in 1924, and prior to that time only a few pounds per year of chromic acid were used, and it was imported at a high price. The growth in total chromic acid consumption has been almost linear since 1924, at an annual increase of about 1,000,000 lb./yr., with a tendency to a higher growth rate of more like 2,000,000 lb./yr. in the past ten years.21 Dr. Blum estimated about 15,000,000 lb./yr. of chromic acid consumed in plating in 1948.17
Flake electrolytic chromium metal is also produced and used in the production of high-chromium alloys, and for the final adjustment of the composition of stainless steel. The process was developed by the U.S. Bureau of Mines and consists basically of the electrolysis of chromium ammonium sulfate solution with stainless steel cathodes, from which the electrolytic chromium is flaked off every three or four days. The Union Carbide Corporation started producing about 4,000,000 lb./yr. in 1954,22 and this was later increased to about 6,000,000 lb./yr. by increasing the size of the cathodes to make more complete use of the solution depth available. Some electrolytic flake chromium metal is produced similarly in Japan and Russia.
Cobalt
While the electrodeposition of cobalt and its alloys has been the subject of research for a long time, the commercial use was somewhat restricted by the cost, generally about double that of nickel. Usage has developed in magnetic coatings for memory devices, and to replace nickel during nickel shortages. The Cobalt Information Center reported the use of about 165,000 to 220,000 lb./yr. in 1968, plus about 55,000 to 66,000 lb./yr. for electroless plating.
Copper
Copper plating has been used from the beginning, but the various fields are very diverse and include electrotyping as well as electroplating, electroforming, electrolytic foil production for printed circuits and other purposes, and electrolytic powder production, and the total annual consumption is relatively unknown. Taylor16 estimated about 1,000,000 lb./yr. in 1929. This seems rather low as the yearbook of the American Bureau of Metal Statistics gave 14,000,000 lb./yr. in 1928 for "plated ware" of all types.
Dr. Blum estimated17 about 28,000,000 lb./yr. in 1948 (1% of total copper consumption), and this seems a valuable indication of the right order of magnitude. The American Brass Company estimated the use of copper for electroplating and electroforming in 1953 to be between 12,000,000 and 15,000,000 lb./yr. from their knowledge of copper anode sales.
Amax Copper, Inc., gave a total in 1962 of about 9,775,000 lb./yr. for alkaline copper plating, and 12,050,000 lb./yr. for acid copper deposition; a complete total of 21,825,000 lb./yr. for 1962. In 1968 this same source estimated 20,300,000 lb./yr. for various metal finishing uses, and a grand total of 38,600,000 lb./yr. including 6,200,000 lb./yr. for foil production, but not including electrolytic copper powder. The Copper Development Association, Inc., estimated 11,500,000 lb./yr. of copper for foil production in 1968. The electrolytic copper powder production was given as about 12,000,000 lb./yr. in 1957.
It is traditional in the copper industry to estimate about 1% of the annual production for electrodeposition purposes; on this basis about 40,000,000 lb./yr. would have been used in 1970 and 1971.
Gold
Technic Inc. estimated gold consumption in electroplating as about 20,000 lb./yr. in 1953, and about 170,000 lb./yr. in 1968. A report23 of the National Materials Advisory Board gives an approximate indication of quantities of gold used by electroplating in various fields. From this we can estimate about 131,500 lb./yr. in 1967 and 137,000 lb./yr. in 1968.. A forecast of about 190,000 lb./yr. is given for 1973.
Iron
The use of electrodeposited iron has varied considerably from time to time. There was formerly a substantial electrolytic iron powder production but this is now negligible and has been replaced by other methods. In 1968 the Van Der Horst Corporation of America were using about 100,000 lb./yr. of iron as an undercoat for hard chromium plate. The Bureau of Engraving and Printing in Washington, D.C., was using about 3500 lb./yr. for printing plates in 1968. The National Cash Register Company calculated that about 75 lb./yr. of iron was consumed in iron-nickel alloy plate in 1968 for computer memory devices and for plating over 30,000,000 ft./yr. of beryllium copper wire. .Allied Research Products, Inc., reported about 1000 gal. of iron sulfamate solution in use in 1969. According to the SKC Corporation about 8,000,000 lb./yr. of electrolytic iron flake metal for the production of special alloys was used in 1968, but was largely imported, and domestic production was being dropped.
Lead
According to the U.S. Bureau of Mines, the use of lead plating is decreasing. They gave a figure of about 1,974,000 lb./yr. in 1953, and 778,000, 812,000 and 534,000 lb./yr. in 1968, 1969 and 1970, respectively. In addition, a consumption of about 4,000,000 lb./yr. was estimated in 1953 in hot galvanizing, and about 6,400,000 lb./yr. in the production of terneplate. A major use at present is in lead-tin alloy plate for printed circuits.
In contrast to the above, Dr. Blum estimated lead plating in 1948 as 22,000,000 lb.17 The Lead Industries Association, Inc., gave a figure of 1,400,000 lb./yr. for 1968 for lead plating.
Manganese
Manganese has not found use in plating, but nearly all of the metal used to alloy with other metals is produced electrolytically. The U.S. Bureau of Mines reported that the consumption of such electrolytic flake manganese was about 51,406,000 lb./yr. in 1968.
Nickel
Figures for the consumption of nickel in electroplating from 1876 to 1958 were given previously.24 This has grown constantly in spite of irregularities in the supply and increasing prices. The consumption was given as 50,866,000 lb./yr. in 1968 by the U.S. Bureau of Mines. The corresponding figure for 1972 was 57,844,000 lb./yr. The world consumption of nickel for electroplating in 1971 was about 131,000,000 lb./yr., about 16% of the total nickel production.25 Originally, in 1869 practically all of the nickel produced was used for plating, and in 1890 this was still about 90%, but now the production of alloys such as stainless steel and other uses take the bulk of the nickel, although the percentage used for plating is increasing currently.
Palladium
Engelhard Minerals & Chemicals Corporation estimated that about 30 lb./yr. of palladium was used in 1968 on electrical contacts and as an electrode catalyst.
Platinum
In 1953, Baker & Company estimated that about 70.6 lb./yr. of platinum was used in plating. Engelhard Minerals & Chemicals Corporation estimated that about 125 lb./yr. of platinum was used for plating in 1968, mainly as an electrode catalyst.
Rhodium
Baker & Company estimated the use of rhodium for plating in 1953 as about 1000 lb./yr. In 1968, Engelhard Minerals & Chemicals Corporation gave a rhodium consumption of about 625 lb./yr. Rhodium plate has been used for jewelry and reflectors.
Silver
In 1929, Taylor16 stated that 17% of the silver sold for industrial uses was consumed in plating. Another source gave 15% of the consumption in 1929 for plating, or 282,000 lb./yr. On the same basis, 1,000,000 lb./yr. was estimated in 1951. Dr. Blum17 gave a figure of 700,000 lb./yr. for 1948. The American Bureau of Metal Statistics estimated 875,000 lb./yr. in 1953. The U.S. Bureau of Mines gave 1,050,000 lb./yr. as the consumption in 1968. Thus, it is apparent that the amount of silver plating has been steady at around 1,000,000 lb./yr. for several decades.
Tin
Taylor16 discussed the use of tin plating in 1929, but did not give a figure for the tonnage of tin consumed. Some idea of the extent of these miscellaneous uses of tin plating can be formed from the fact that the Tin Research Institute, Inc. estimated them roughly 3,500,000 lb./yr. in 1953.
The production of tinplate (strip steel sheet coated with tin) underwent a revolution in World War II days, beginning in the late 1930s. Previously only hot dip tin was used, but electroplating the strip in either acid or alkaline tin plating baths offered substantial economy in the use of tin. This is such a large industry, however, that the amount of tin used in electroplating increased radically, and, in fact, it became the largest single metal electroplate, even exceeding the annual consumption of nickel in electroplating.
Thus, Dr. Blum estimated about 27,000,000 lb./yr. of tin used in plating in 1948.17 The Tin Research Institute estimated about 33,400,000 lb./yr. used in the production of electrotinplate in 1953, plus about 3,500,000 lb./yr. for miscellaneous tin plating, giving a total of about 37,000,000 lb./yr. for tin plating in 1953. In 1968 the indication was for 66,414,000 lb./yr. of tin for tinplate, 4,200,000 lb./yr. miscellaneous uses, 1,400,000 lb./yr. in lead-tin alloy plate, and 200,000 lb./yr. in tin-nickel and tin-copper alloy plates, giving a final total of 72,214,000 lb./yr., not including chemicals used in making up plating baths.
The consumption of tin in tinplate production has been dropping, probably due to increasing use of tin-free steel (TFS) having a very thin chromium plate. Thus the Bureau of Mines figures have been 53,772,000; 50,254,000; 47,338,000; and 38,652,000 lb./yr. for 1969, 1970, 1971 and 1972 respectively.
Zinc
Taylor16 gave the amount of zinc used in zinc plating as certainly more than 20,000,000 lb. in 1929. Morral26 gives a zinc consumption in plating during the 1930s varying from about 4,000,000 lb./yr. in 1933-1934 to over 12,000,000 lb./yr. in 1940. Dr. Blum17 gave a figure of 32,000,000 lb./yr. in 1948, 2% of the total zinc consumption. In 1953, the American Zinc Institute estimated 30,000,000 lb./yr., but Dr. Saltonstall considered this figure quite low. In 1968, the Zinc Institute, Inc. estimated the use of 10,000,000 lb./yr. of zinc for rustproofing various parts, but excluding the electrogalvanizing of steel sheet and wire. The Zinc Development Association estimated 60,000,000 to 80,000,000 lb./yr. of zinc used for plating in the entire world, from which one might estimate about half used in the United States or 30,000,000 to 40,000,000 lb./yr.
The difficulty with figures on zinc is that the amount used in plating steel sheet and wire is unknown. The amount of zinc used in hot-dip galvanizing has been approaching 1,000,000,000 lb./yr. in recent years, and thus completely dwarfs the amount of zinc applied by electrogalvanizing. The quantity of zinc used in electrogalvanizing is not recorded separately, and is merely included as an unknown fraction of the total used in both hot and electrogalvanizing for rust proofing purposes.
The double standard of electrode potentials - pH and reference electrodes
The pH scale
It is not commonly realized that the pH scale is primarily a scale of the potential of the platinized platinum hydrogen electrode in acid and alkaline solutions, and thus a second and separate scale of electrode potentials. The history of the creation of the pH scale has to be examined carefully to make this clear.27
The behavior of platinized platinum in acids and alkalies was known in the 1800s. However, it was not until 1893-1894 that LeBlanc27a and Smale27b proposed its use as a reference electrode, and felt that they showed that it was reversible with reference to the solution and to the deposition of hydrogen. Nernst28,29 seems to be silent on this, although he was responsible for the acceptance of the normal hydrogen electrode as the zero of electrode potential,30-32 instead of the calomel electrode as recommended by Ostwald.
The strength of various acids and bases was investigated in 1878-1894 by Ostwald, Arrhenius, and Nernst,28 among others (reference 28, pages 606-609). In 1895, LeBlanc33 gave a good summary of the situation (reference 33, pages 178-181). He pointed out that the potential difference between two hydrogen electrodes, one in a normal solution of acid and the other in normal alkali, was 0.81V at 18°C and that the acid would be about 0.8 normal in hydrogen ion.
He calculated that the concentration of hydrogen ions in the alkali would be 0.8×10⁻¹⁴, while that of the hydroxyl ions would be about 0.8 normal. From this he calculated further that pure water would be about 0.8×10⁻⁷ normal with regard to both hydrogen and hydroxyl ions.
Nernst (reference 28, pages 598-600) discusses the electrolytic dissociation of pure water, and points out that it was determined by a variety of methods by various workers in 1893-1896, and has a surprisingly high temperature coefficient. While the hydrogen ion concentration of water was about 0.7-0.8×10⁻⁷ normal at 18°C, at 25°C it was found to be in the range 1.1 to 1.2×10⁻⁷ normal.
Thus, about 14 or 15 years before the introduction of the pH scale for acidity and alkalinity, the stage was set completely for Sorensen in 1909 to dub this in on the hydrogen electrode potentials of neutral solutions, and acid and alkali to 1N strength. Sorensen34 did this in the midst of a 173-page study of the effect of hydrogen ion concentration on enzyme action (reference 34, pages 159-160; chart between pages 176-177). This paper was published simultaneously in Danish, French and German but, unfortunately, not in English. Even more unfortunately, the chart was published separately as a large wall chart, and not reprinted in later textbooks. Thus, W.M. Clark refers35 vaguely to the "Sorensen-Michaelis Map" or later44 to just the "Sorensen Map," without indicating explicitly that he means this chart.
The chart in question was also confusing in that titration curves of various buffers were superimposed upon the new pH scale. Figure 2 shows Sorensen's original chart of the proposed pH scale applied to the potential of the hydrogen electrode measured against the 0.1 normal calomel electrode, with the potentials reversed and the buffer curves eliminated. Sorensen mentioned in a footnote that the new pH scale gave positive numbers for the concentration of hydrogen ion, except for acids stronger than one normal, where the pH was negative.
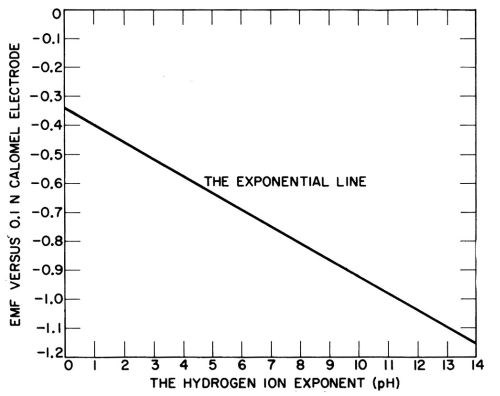
Figure 2 - Sorenson’s original chart in 1909 of the pH scale applied to the potential of the hydrogen electrode, with the potentials reversed and buffer titrations eliminated.
The new pH scale was criticized at first as substituting unnecessary numbers for the potentials of the hydrogen electrode in various media, but during the 1920s it came to be widely adopted, and the primary position of the hydrogen electrode was lost sight of. It was easier to say that the acidity changed one pH unit, than that the potential of the hydrogen electrode was 0.059V higher or lower. Nevertheless, the primary meaning of a pH unit is that it corresponds to 0.059V change in hydrogen electrode potential.
Michaelis adopted the pH scale promptly, and published a book on hydrogen ion concentration in 1914,36 with a second edition in 1922 followed by an English edition in 1926.37 The second edition appeared in two parts, the second part having the title, Oxidation - Reduction Potentials.38 The second part was translated into English,39 and appeared in still another edition.40
The outstanding American promotion of the use of the pH scale came in the book of W. Mansfield Clark on the Determination of Hydrogen Ions, which appeared in three editions in less than ten years.41-43 However, Clark soon realized that the pH scale, while convenient, obscured the fundamental measurement, which was the potential of the hydrogen electrode. The shortcomings of the pH scale were discussed in the last edition of his book in 1928 (reference 43, pages 38-40, 545).
In his Nichols Medal address in 1936,35 Clark said: "For a still distant date the author has contemplated a new edition of this book, written on a more consistent basis, and from it there might be eliminated the term 'pH'." However, the complete change which occurred in Clark's attitude towards the pH scale seems to have been lost in the flowery language of his address.35
True to his word, Clark never did re-edit his book on The Determination of Hydrogen Ions. Following retirement from teaching at Johns Hopkins in 1952, he produced an outstanding work on Oxidation - Reduction Potentials of Organic Systems, published in 1960.44 Clark was proud of his habit of writing as he pleased, but this last book appears to take a conventional attitude toward the use of the pH nomenclature. He describes the improbable or impossible concentrations or gas pressures resulting from the Nernst theory as ".. mere calculation numbers" (reference 44, pages 24-26).
Clark seems to have succumbed to the heavy pressure of the circumstances, and says (reference 44, page 27): "An apparent exception to this will be our use of pH numbers for conditions such that their interpretation in the ordinary manner is of doubtful physical significance. We use pH numbers as a concession to custom and as a convenience while having noted in Section 4 that pH numbers could be replaced."
Clark discusses large negative pH numbers (reference 44, page 14), as having no physical meaning, but does not seem to offer any explanation or way out of the difficulty. Thus, Lewis and Randall in two editions,45,46 call attention to the fact that concentrated hydrochloric acid (16M) appears from emf measurements to have an activity coefficient of the hydrogen ion of about 43, or in other words it is more than 4000% dissociated! This is consistent with the experience of chromium plating workers that strong hydrochloric acid is about the only acid that will strip chromium plate all by itself, but points up the lack of meaning or inadequacy of our measurement system.
Clark (reference 44, page 14) concludes his discussion of pH numbers such as -4 or -10, etc. by saying: "It is quite obvious that it never was the intention to have 'pH = -10' interpreted as either an activity or a concentration of 10,000,000,000 ... Had there been used the standardized value of Eh, it could have been more easily interpreted as indicative of the availability of protons." (hydrogen ions).
On page 15 Clark says: "... we use the behavior of a hydrogen electrode as the operational basis, ..." The present writer takes this expression to mean that the behavior of the hydrogen electrode is the important experimental result, or the significant measurement.
Another of the most important proponents of the pH scale who ultimately seems to have become disillusioned with it was Holger Jorgensen of Copenhagen, a close associate of Sorensen himself. Jorgensen published an enthusiastic book on the value of pH measurements in 1935,47 in which he lamented that the opportunity had been lost to designate the important new pH unit degrees Sorensen, °S, similar to °C for temperature.
Sorensen died in 1939. He may have passed on to Jorgensen some questions as to the value of the pH scale. At any rate, Jorgensen proposed the use of pE units instead of pH units in a little booklet in 1945,48 but unfortunately this booklet is almost unknown and attracted almost no attention. Figure 3 taken from Jorgensen's book shows how he substitutes a pE scale for the pH scale, and the relation of each to the potential of the hydrogen electrode, Eh.
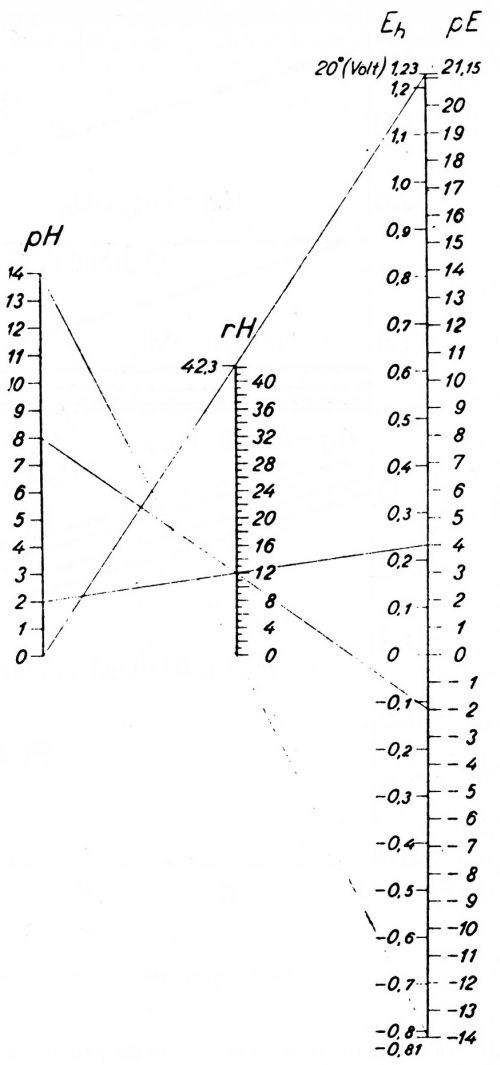
Figure 3 - Jorgensen’s chart of the pH scale and his proposed substitute pE scale, and the relation of both to the potential of the hydrogen electrode (Potentials reversed compared to American practice). Reproduced with permission from Jul. Gjellerups Forlag a-s, Copenhagen.
Luder and Zuffanti published an excellent book on The Electronic Theory of Acids and Bases in 1946,49 but this book also seems to have had almost no effect on the use of the pH scale, even though it has had widespread acceptance. However, it did not extend its coverage to include the hydrogen electrode and the pH scale.
It is evident that the use of the pH scale has obscured its more important significance, the potential of the hydrogen electrode. One has to stop to think when reading the scientific literature, and particularly whenever results are plotted with varying pH; oh!, that means they vary with the voltage of the hydrogen electrode. Even if pH is determined with indicators or with a glass electrode, the real meaning of the resultant number is the voltage that the hydrogen electrode would have in the solution in question. This result is secured by calibration against known buffer solutions.
Reference electrodes
While electrochemists attempt to consider reference electrodes on a single scale of electrode potentials, such electrodes appear to be of two types, and to require two different potential scales. Perhaps it may be considered that clean metal surfaces have one scale of electrode potentials often known as the electromotive force series (reference 50, page 1134; reference 51, page 88), but metals coated with oxide, or equivalent surfaces, are sensitive to acid or alkali and show a different response requiring a different scale. Thus reference electrodes fall into two classes according to whether or not they respond to acid and alkali.
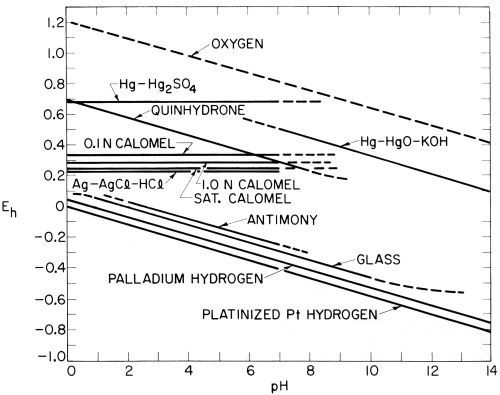
Figure 4 - Approximate potentials of common reference electrodes in solutions of varying pH.
Clark (reference 43, page 259; reference 44, page 264) diagrammed this difference between hydrogen and quinhydrone electrodes on the one hand, and calomel electrodes on the other, but confined his diagram to acid solutions in the range of pH 0-7. Extending the range from pH 0-14 and including data on some other common reference electrodes taken largely from Potter,51 the writer constructed the diagram shown in Fig. 4. While this is only of approximate accuracy, it shows the difficulty of conversions from one reference electrode to another, especially if these are of different types and used in solutions of varying pH.
Thus, one cannot make measurements with the saturated calomel electrode in neutral solutions around pH 7 and then convert them to the hydrogen scale by subtracting 0.244 V, as is sometimes done. This conversion would only be correct at pH 0, and a further conversion to the potential of the hydrogen electrode at pH 7 is necessary if the results are really desired to be transposed to the hydrogen scale.
In a similar vein, there are many artifacts in the literature due to measuring potentials in solutions of widely different pH with a reference electrode of the calomel electrode type, instead of using a pH-sensitive reference electrode such as the hydrogen electrode or the glass electrode. A few examples may serve to illustrate the point.
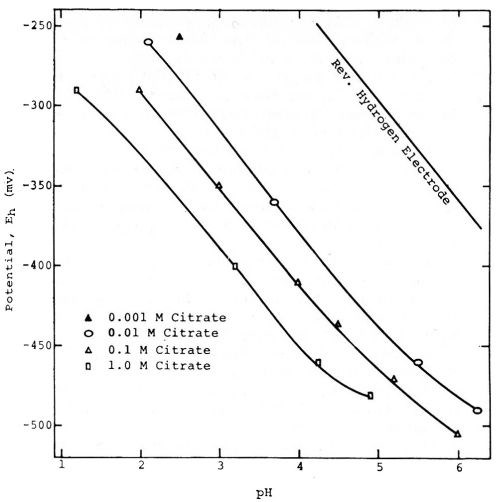
Figure 5 - Willey's measurements of the potentials of tin in solutions of varying pH. Reprinted with permission from Brit. Corrosion J.
Figure 5, taken from a paper by A.R. Willey52 shows that tin can exhibit an almost perfect "hydrogen electrode behavior" over certain ranges of pH. It is obvious that if the potentials had been measured against the hydrogen or a similar electrode as zero instead of the 0.1N calomel electrode, that they would be relatively constant for each condition, and most of the variation would be eliminated.
Figure 6 gives some curves of the potential of chromium in solutions of almost the entire pH range of zero to 14, measured against, the calomel electrode, as reported by Knoedler and Heusler.53 In this case, the chromium is exhibiting a hydrogen electrode behavior. The potential of a hydrogen electrode varies about 828 mV between pH zero and pH 14, and it is evident that if these measurements were to be made against a hydrogen or other pH-sensitive electrode as zero, most of the variation would be eliminated and the curves would tend to coalesce into a single line.
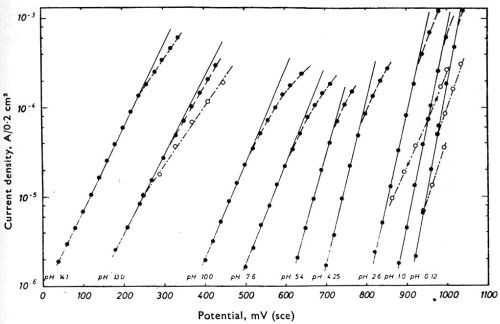
Figure 6 - Knoedler and Heusler's measurements of the potential of chromium against the saturated calomel electrode in solutions of varying pH. Reprinted with permission from Pergamon Press.
Figure 7 shows some measurements on platinum with a calomel electrode as reported by Carr and Hampson.54 The two solutions used were about pH 1 and pH 13, about 0.7 V apart on the hydrogen scale, and, if the measurements were made with a hydrogen electrode as zero, the two curves would tend to slide together into a single curve.

Figure 7 - Carr and Hampson's measurements of the potential of platinum against the calomel electrode in 0.13M H2SO4 (circles) and 0.19M NaOH (dots). Reprinted with permission from Pergamon Press.
These three examples should suffice to show the importance of using a pH-sensitive reference electrode when making measurements in solutions of varying pH, or else using the proper conversion from one scale to the other. At any rate, the very nature of the results obtained depends upon the type of reference electrode selected.
On the nature of electrode potentials and hydrogen overvoltage
There has been much confusion and lack of progress in dealing with the question of the nature of electrode potentials and hydrogen overvoltage. Definitions of what is meant by "overvoltage" or "hydrogen overvoltage" have varied widely, and this has been a substantial part of the problem. Bockris titled an article in 1971, "Overpotential - A Lacuna In Scientific Knowledge."55
There would seem to be no harm in going back to the publications of Nernst and his student Caspari in 1899 for the definition of overvoltage, since they appear to have coined the term and were about the first to clearly separate the quantity from the broader term "polarization" used before that time. Kremann and Muller56 give references to the earlier developments (reference 56, page 100, Part 2). Caspari's work was published in two papers,57,58 the first being presented by a colleague, A. Coehn. Caspari did not state a definition of "Ueberspannung" (overvoltage), but he used as his zero of potential or reference electrode the platinized platinum hydrogen electrode, whether it was in 1N H2SO4 or 1N NaOH, even though he knew its potential was actually more than 0.8V different in these two solutions.
Thus, Nernst’s definition of overvoltage was given later as (reference 56, page 102, my translation): "... the potential of the cathode at which just visible hydrogen evolution appears, referred to a reversible hydrogen electrode in the same electrolyte through which no current is flowing, and under the same external conditions with reference to pressure and temperature."
Later workers extended the definition to include the overvoltage at a given current density of a working electrode, the reference hydrogen electrode remaining on open circuit and having no current flowing to it. Dr. Blum59 stated (reference 59, page 366)" ... overvoltages for evolution of hydrogen should measure the departure of the cathode potential from that of a reversible hydrogen electrode in that solution."
While sometimes stated in different terms, this definition is still in use today. Thus, a tentative definition of the IUPAC circulated in November, 1972, stated:60 "Overpotential (SI unit V) is the deviation of the potential of an electrode from its equilibrium value required to cause a given current through it."
Thus, we see that the definition of hydrogen overvoltage requires that it be measured against the potential of the hydrogen electrode in the same solution as zero, something which has not always been done. Since the potential of the hydrogen electrode is synonymous with pH, calling the hydrogen electrode zero automatically eliminates any possible effect of pH on hydrogen overvoltage. In a way this creates a new scale of electrode potentials, the vertical distance from the downward slanting line of the hydrogen electrode in Fig. 4 taken as zero, to any of the other electrodes.
Related Content
Innovation in Plating on Plastic
Plating on advanced plastics solution offers improved adhesion, temperature resistance and cost savings.
Read MoreProducts Finishing Reveals 2023 Qualifying Top Shops
Each year PF conducts its Top Shops Benchmarking Survey, offering shops a tool to better understand their overall performance in the industry. The program also recognizes shops that meet a set of criteria to qualify as Top Shops.
Read MoreHow to Maximize Nickel Plating Performance
The advantages of boric acid-free nickel plating include allowing manufacturers who utilize nickel plating to keep up the ever-changing regulatory policies and support sustainability efforts.
Read MoreA Chromium Plating Overview
An overview of decorative and hard chromium electroplating processes.
Read MoreRead Next
A ‘Clean’ Agenda Offers Unique Presentations in Chicago
The 2024 Parts Cleaning Conference, co-located with the International Manufacturing Technology Show, includes presentations by several speakers who are new to the conference and topics that have not been covered in past editions of this event.
Read MoreEpisode 45: An Interview with Chandler Mancuso, MacDermid Envio Solutions
Chandler Mancuso, technical director with MacDermid Envio discusses updating your wastewater treatment system and implementing materials recycling solutions to increase efficiencies, control costs and reduce environmental impact.
Read MoreDelivering Increased Benefits to Greenhouse Films
Baystar's Borstar technology is helping customers deliver better, more reliable production methods to greenhouse agriculture.
Read More


.jpg;maxWidth=300;quality=90)


